Figure 7.

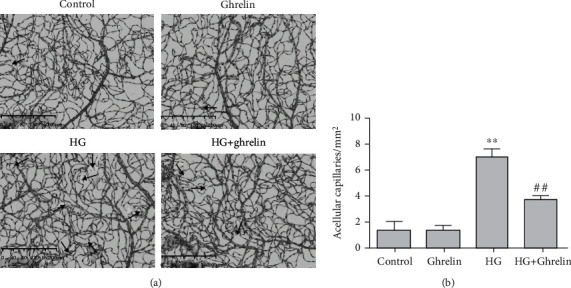
Retinal trypsin digestion assay: (a) black arrows indicate acellular vessels and (b) acellular vessels were quantified. ∗∗P < 0.05 vs. control group; ##P < 0.05 vs. HG group.

Retinal trypsin digestion assay: (a) black arrows indicate acellular vessels and (b) acellular vessels were quantified. ∗∗P < 0.05 vs. control group; ##P < 0.05 vs. HG group.