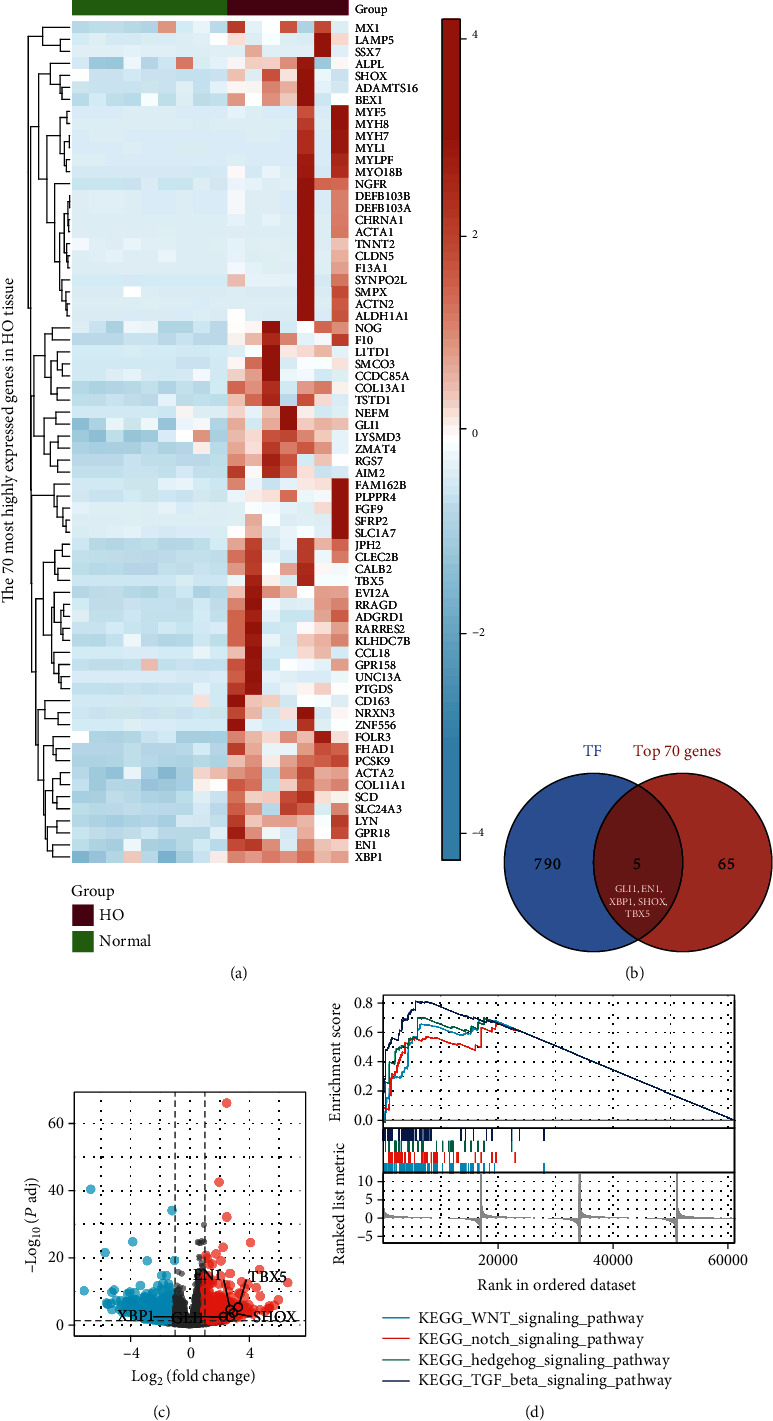
Figure 1.

Characterization of the differential expression and enrichment pathways of transcription factors in ectopically ossified tissues. (a) Heat map of the top 70 genes expressed in heterotopic ossification (HO) tissues. (b) Intersection of the top 70 genes and 795 genes from the TTRUST database. (c) Volcano plot of five differential transcription factor expression levels based on GSE94683 data. (d) Visualization of four HO-related KEGG pathways based on GSEA results. GSEA: Gene Set Enrichment Analysis; KEGG: Kyoto Encyclopedia of Genes and Genomes.
