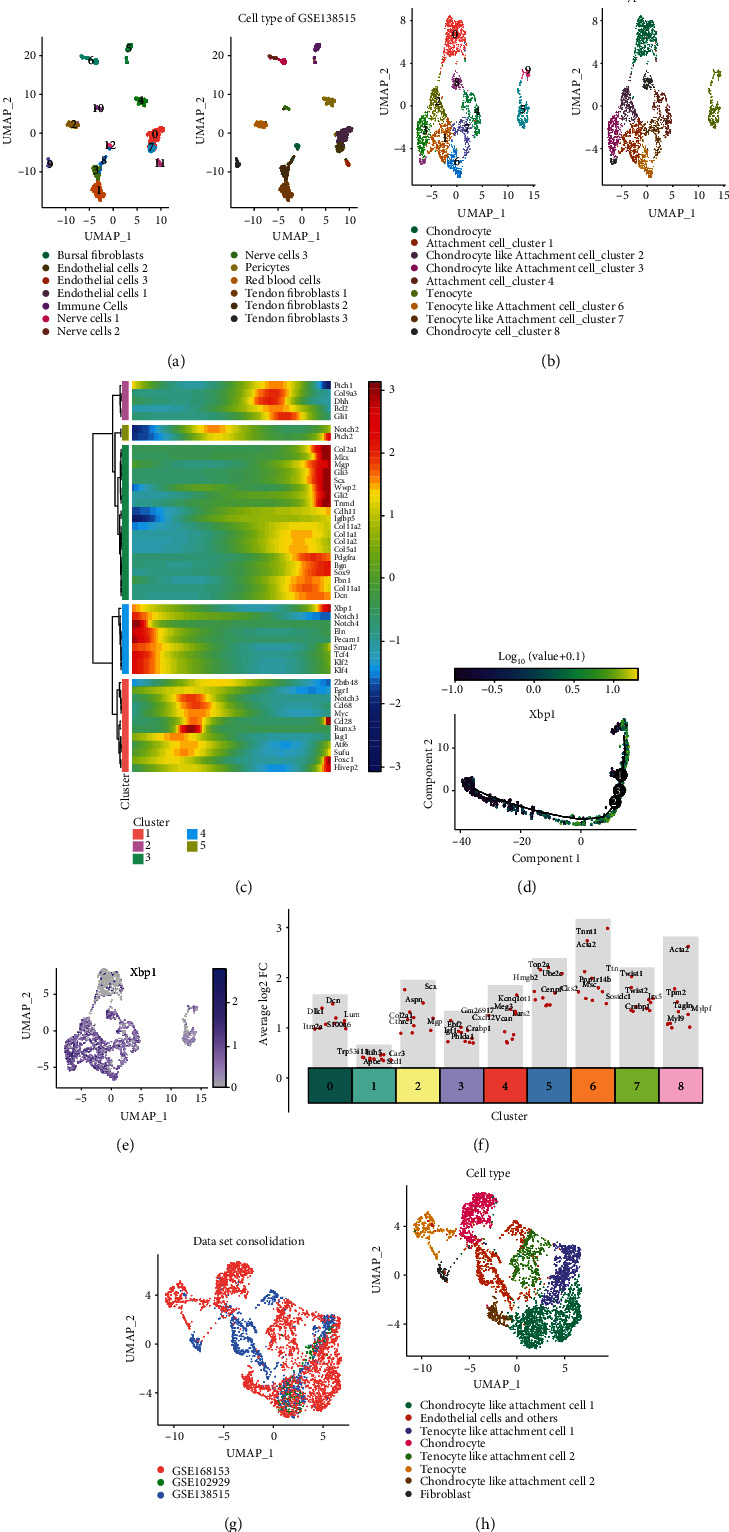
Figure 4.

Ectopically ossified cells have similar transcriptional characteristics to cells in the tendon fibrocartilaginous region. (a) For GSE138515, cell clustering and annotation are shown on the uniform manifold approximation and projection (UMAP) plots. (b) For GSE168153, cell clustering and annotation are presented on the UMAP plots. (c) For GSE168153, the key gene expression features of ectopic ossification and the tendon fibrocartilaginous zone are presented with a pseudo-temporal analysis. (d) Expression features of Xbp1 on pseudo-temporal trajectories. (e) Expression characteristics of Xbp1 in different cells in GSE168153 shown on the UMAP plots. (f) Differential gene expression analysis of the top 5 genes showing upregulated expression in all eight clusters in the integrated dataset (including GSE168153, GSE138515, and GSE102929 under simulated HO pathological conditions). (g) UMAP plots showing the distribution of the different datasets. (h) Cellular annotations for the integrated datasets are shown on the UMAP plots, with different colors representing cell types.
