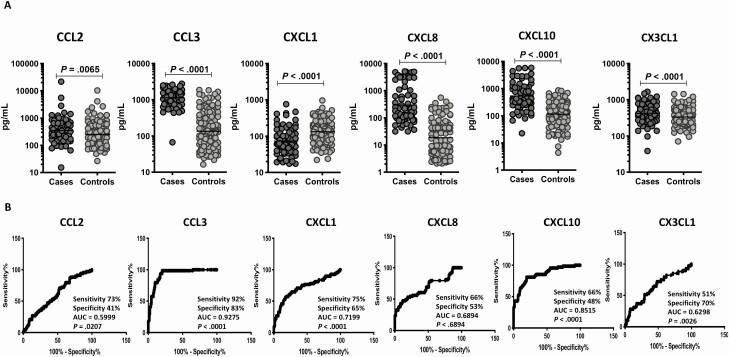
Figure 1.
Elevated baseline plasma levels of chemokines in cases in the test cohort. A, The baseline plasma levels of chemokines were measured in cases (n = 68) and controls (n = 133). The data are represented as scatter plots, with each circle representing a single individual. P values were calculated using the Mann-Whitney test with Holm’s correction for multiple comparisons. Only chemokines that showed significant P values are shown. B, Receiver operator characteristic analysis to estimate the sensitivity, specificity, and AUC was performed using chemokines to estimate the capacity of these factors to distinguish cases vs controls. Abbreviation: AUC, area under the curve.

