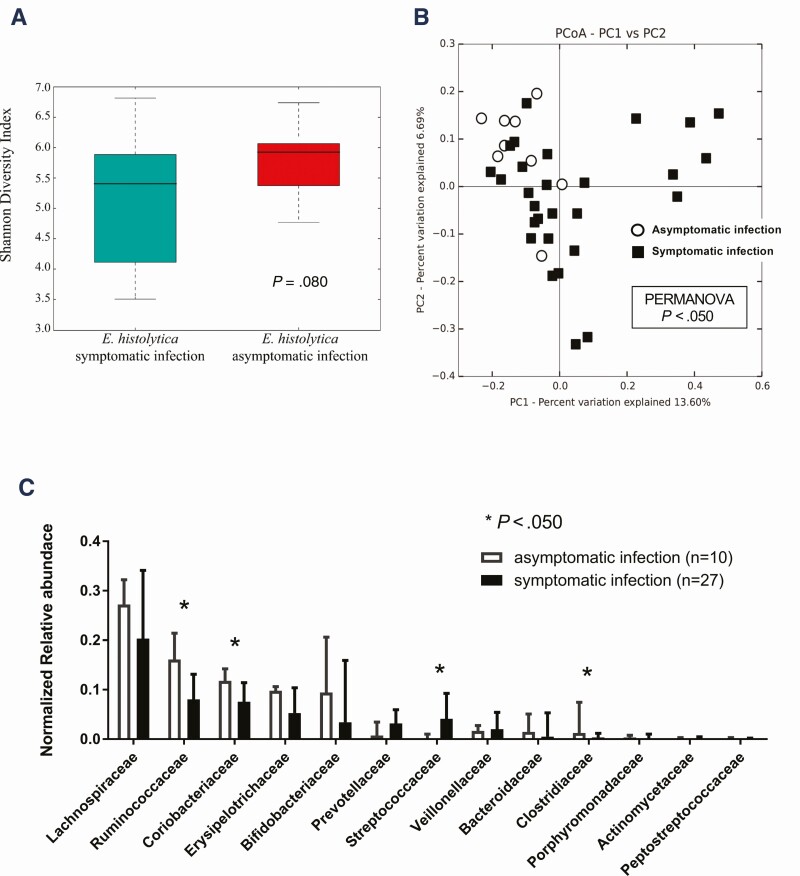
Figure 2.
Composition of the gut microbiota between asymptomatic and symptomatic invasive infections of Entamoeba histolytica. A, Comparison of α-diversity using the Shannon diversity index. B, Principal component analysis (PCoA) of each stool from asymptomatically (white circle) or symptomatically (black square) infected individuals. The first 2 principal components (PC1 and PC2) are shown. The variation (%) explained by each PCoA axis is given. C, Normalized relative abundance of 13 taxa that occurred in at least 0.1% abundance at the family level. The microbiomes (family level) were compared between symptomatic invasive and asymptomatic infections. *P < .05.

