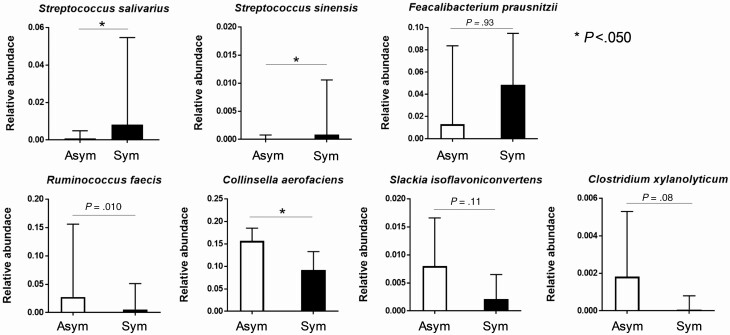
Figure 3.
Comparison of the gut microbiotas at the species level. Normalized relative abundance of bacteria that showed significant differences at the family level between asymptomatic (Asym, white bars) and symptomatic invasive infections (Sym, black bars) (see Figure 2C) were compared at the species level. The relative abundance of gene expression levels of bacteria were normalized according to the predicted 16S ribosomal RNA gene abundances (*P < .05, Mann-Whitney U test).

