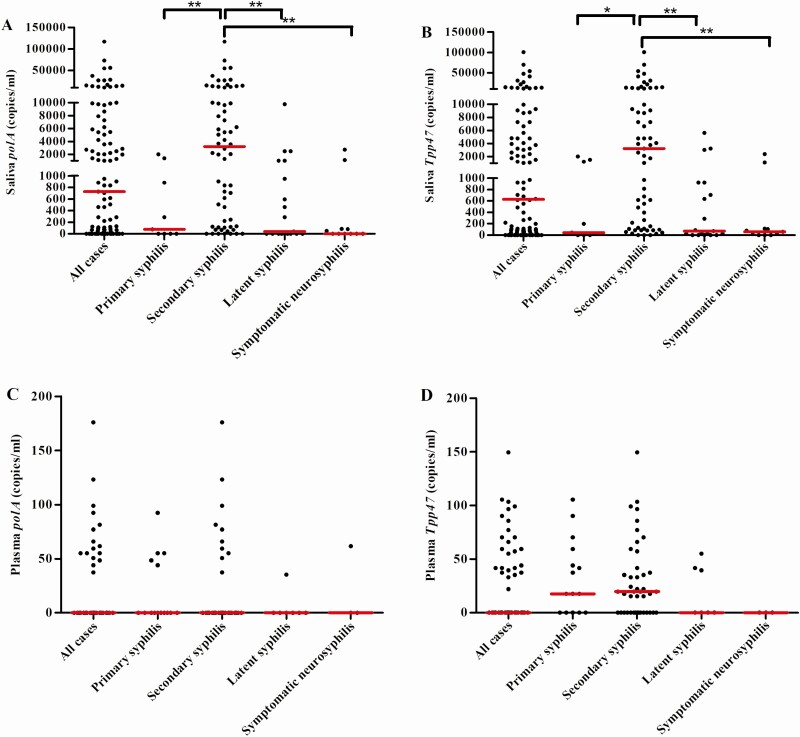
Figure 2.
The quantity of Treponema pallidum DNA in saliva and plasma from patients with different stages of syphilis. The loads of polA (A) and Tpp47 (B) in saliva from all cases (n = 101), primary syphilis (n = 9), secondary syphilis (n = 62), latent syphilis (n = 19), and symptomatic neurosyphilis (n = 11). The loads of polA (C) and Tpp47 (D) in plasma from all cases (n = 68), primary syphilis (n = 15), secondary syphilis (n = 43), latent syphilis (n = 7), and symptomatic neurosyphilis (n = 3). The red horizontal lines show the medians.*P < .05; **P < .001. Three saliva-positive samples and 1 plasma-positive sample were not further quantified because there was not enough DNA template.

