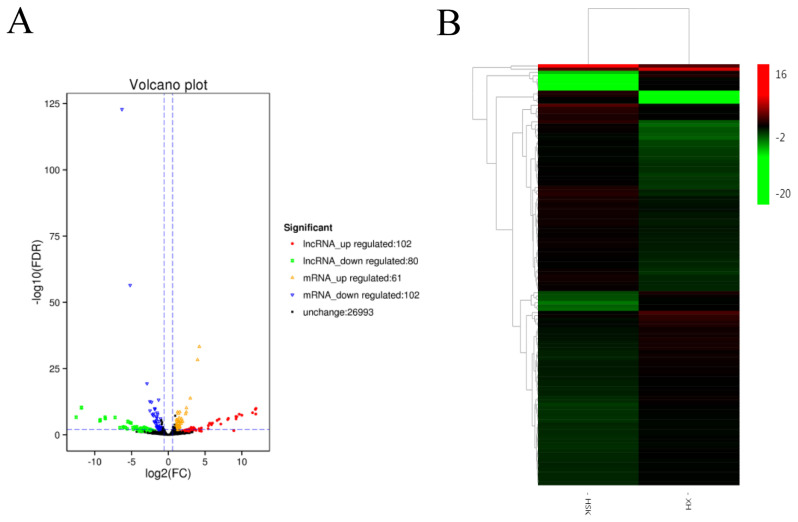
Figure 2.
Long noncoding RNA (lncRNA) expression differed between Kazakh cattle and Xinjiang brown cattle. (A) Volcano plot showing upregulated lncRNAs (red), downregulated lncRNAs (green), upregulated genes (orange), downregulated genes (blue), and nondifferentially expressed genes (black). (B) Heatmaps showing the differential expression of lncRNAs; each column represents a sample, and each row represents a dysregulated RNA transcript. A red stripe indicates that an RNA was upregulated in a sample, whereas a green stripe indicates the opposite.

