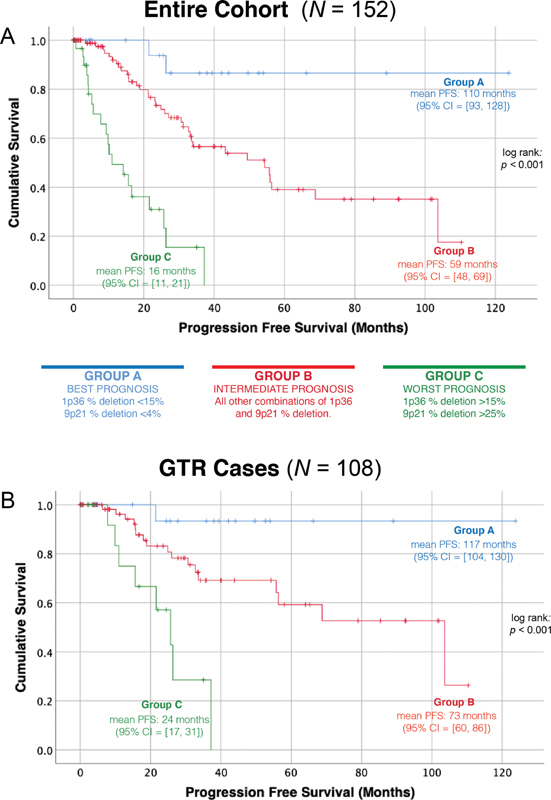
Fig. 1.

PFS after surgery by genetic risk group. Kaplan–Meier PFS after surgery curves confirm that the observed differences in PFS between the three genetic risk groups when all cases are analyzed ( A ) persist regardless of the radicality of the surgical outcome ( B ). PFS, progression free survival.
