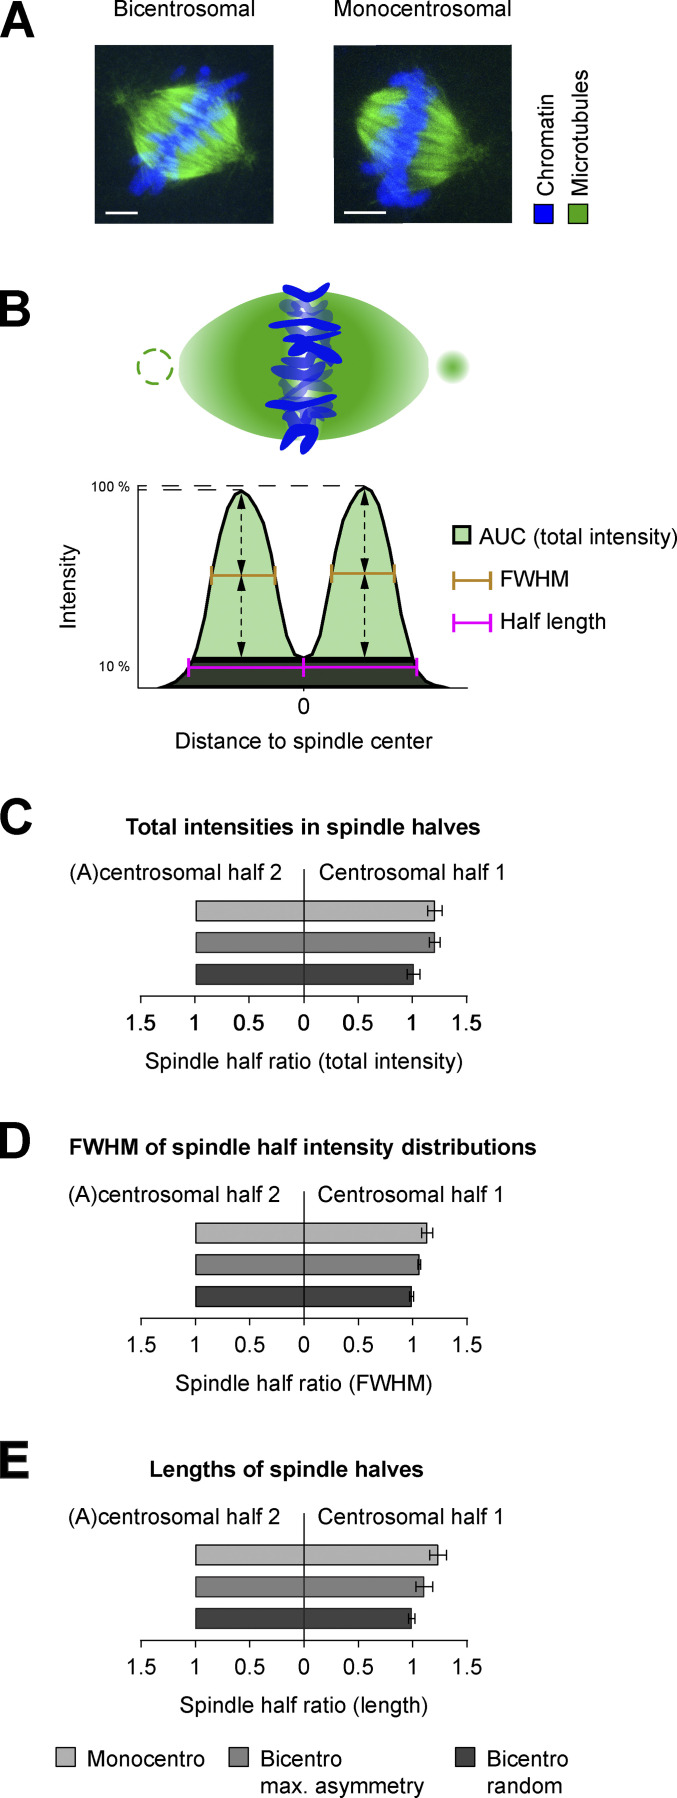
Figure 2.
Quantitative comparison of proximate and distant dual spindles. (A) Exemplary IF data subjected for quantitative comparison of proximate bicentrosomal and distant monocentrosomal spindles (see also Fig. 1, A and B). Metaphase spindles of bovine zygotes fixed at 27.5 h after IVF. Maximum intensity projections over the imaging plane (z) are shown. (B) Schematic representation of zygotic metaphase spindle and total intensity distribution along determined spindle axis orthogonal to the chromosomes in bicentrosomal contralateral and monocentrosomal spindles. Note dashed circle to illustrate second centrosome in bicentrosomal spindles and missing centrosome in monocentrosomal spindles. FWHM was considered as an estimate of intensity distribution and AUC as a sum of total intensities in each spindle half; the half-lengths were calculated as distances between the intensity distribution’s valley (0 position) and the most distant positions along the axis, where the total intensity was 10% of the respective maximum. (C–E) Ratiometric comparison of total intensity (C), FWHM (D), and of the length (E) between the halves of the spindle types. For distant monocentrosomal spindles (Monocentro; n = 11 from 6 embryos), absolute measurements were normalized to acentrosomal half. For proximate bicentrosomal contralateral spindles (Bicentro max. asymmetry; n = 16), absolute measurements were normalized to the spindle half with lower sum intensity or shorter FWHM and length. Randomly normalizing the halves of these bicentrosomal spindles (Bicentro random; n = 16) shows that such small asymmetries are usually averaged out upon random comparison. Error bars indicate SEM. Statistical tests: two-tailed unpaired Student’s t test. (C) Mean intensity ratio between centrosomal and acentrosomal halves of monocentrosomal spindles (Monocentro, 1.21) was comparable to the ratio between brighter and dimmer halves in bicentrosomal spindles (Bicentro max. asymmetry, 1.21, P = 0.99). (D) Comparable mean ratio of FWHM of monocentrosomal spindle halves (Monocentro, 1.14) and bicentrosomal spindle halves when normalized to highlight natural asymmetry (Bicentro max. asymmetry, 1.06, P = 0.12). (E) Overall similar mean ratio of spindle half-lengths in mono- (Monocentro, 1.24) and bicentrosomal (Bicentro max. asymmetry, 1.11) spindles (P = 0.07) when normalized to highlight natural asymmetry.

