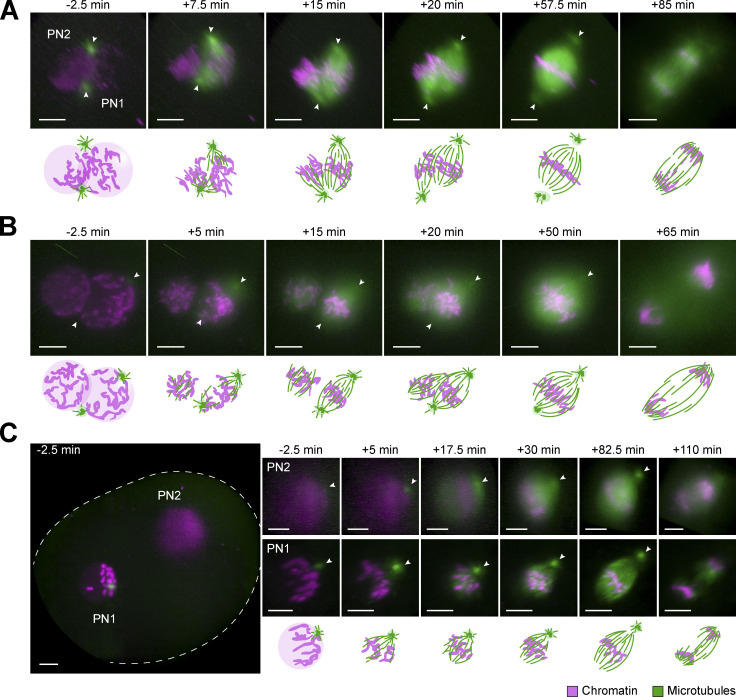
Figure 3.
Assembly and dynamics of proximate and distant dual spindles in live bovine zygotes. (A–C) Bovine zygotes expressing microtubule markers (EGFP-MAP4 in A or EB3-mEGFP2 in B and C, green) and chromatin marker (H2B-mCherry, magenta) were imaged by light-sheet microscopy every 2.5 min throughout mitosis and for up to 6 h in total. 3D-rendered images of pronuclear volumes are shown. Overview image to illustrate pronuclear distance (C) is a background-corrected (median-based denoising) overlay of maximum intensity projections over z of both pronuclear volumes within the zygote (zygotic rim indicated by dashed lines). Timings are respective to synchronous pro-NEBD (B) or to NEBD of leading PN (PN1) in case of asynchrony (A and C). PN2, lagging PN. Arrowheads indicate positions of centrosomes. Projected scale bars, 10 µm. (A and B) Most frequent (A) and most pronounced (B) example of proximate dual spindle assembly. (C) Example of distant dual spindle assembly with two individual monocentrosomal spindles throughout mitosis.

