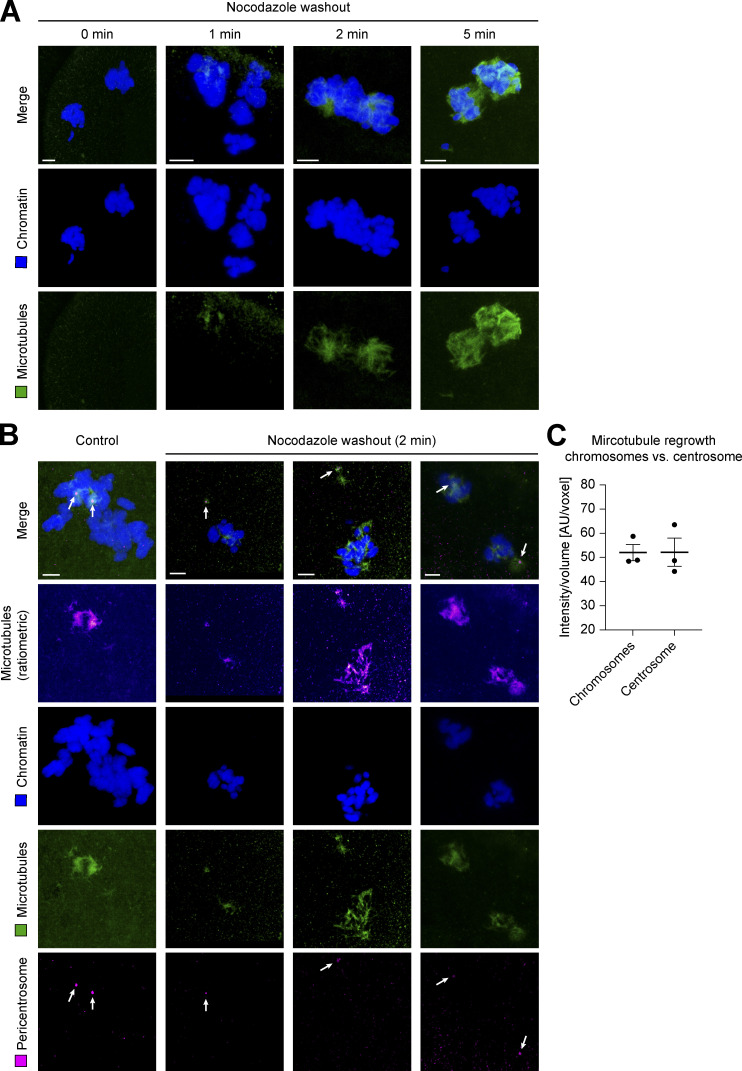
Figure S5.
Microtubule regrowth at chromosomes and centrosomes after nocodazole washout during pro-metaphase of first mitotic division in the bovine zygote. (A) IF staining of bovine zygotes fixed after 0, 1, 2, and 5 min of microtubule regrowth after washout from incubation at 5 µM nocodazole for 4 h (starting at 27.5 h after IVF). Maximum intensity projections of confocal sections are shown for chromatin (Hoechst, blue) and microtubules (α-tubulin, green). Scale bars, 5 µm. (B) IF staining of bovine zygotes fixed at 27.5 h after IVF (control) and of three example zygotes after 2 min of nocodazole washout as in A. Maximum intensity projections of confocal sections are shown for chromatin (Hoechst, blue), microtubules (α-tubulin, green), and pericentrosome (Nedd1, magenta). Additional ratiometric representation of microtubules (α-tubulin, fire). Arrows indicate pericentrosome positions. Scale bars, 5 µm. (C) Quantification of microtubule mass (intensity/volume) at chromosomes and the centrosome after nocodazole washout for 2 min (n = 3). Equal growth at both sites shown by equal intensities at both sites (mean intensity of 50.0 at chromosomes vs. 50.1 at centrosomes). Error bars indicate SEM intensity.

