Figure 3.
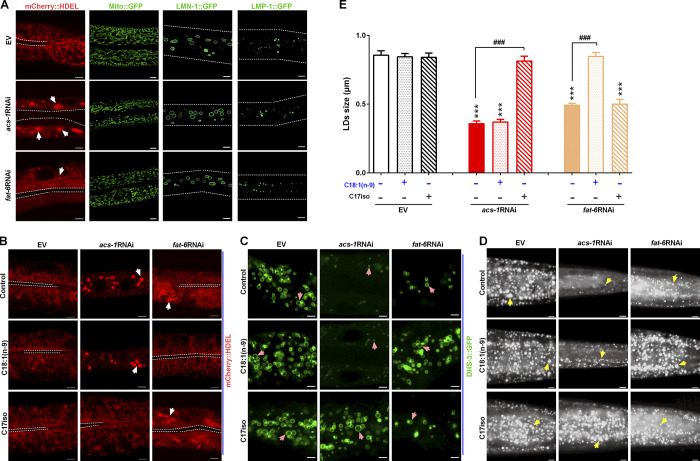
ACS-1 derived C17iso is necessary for maintaining the ER integrity for LD growth. (A) Visualization of the ER morphology by SEL(1–79)::mCherry::HDEL {N2;hjSi158[vha-6p::sel-1(1–79)::mcherry::hdel::let-858 3′ utr]}, imaged by two-photon confocal microscopy, scale bar represents 5 µm. The white dashed lines indicate the lumen of worms, and the white arrows indicate the aggregation of the ER. The morphology of mitochondria, nuclear, and lysosome was visualized by Mito::GFP (N2;mito::gfp), LMN-1::GFP {ccIs4810[lmn-1p::lmn-1::gfp::lmn-1 3′utr+dpy-20(+)]}, and LMP-1::GFP {unc-119(ed3);pwIs50[lmp-1p::lmp-1::gfp+unc-119(+)]}, respectively, imaged by high resolution laser confocal microscopy. Scale bar represents 5 µm for Mito::GFP, and 10 µm both LMN-1::GFP and LMP-1::GFP. The white dotted lines indicate the worm boundaries. (B) Visualization of ER morphology by mCherry::HDEL with dietary C18:1(n-9) or C17iso treatment, imaged by two-photon confocal microscopy, scale bar represents 5 µm. The white dashed lines indicate the lumen of worms, and the white arrows indicate the aggregation of the ER. (C) LDs visualized by DHS-3::GFP with dietary C18:1(n-9) or C17iso treatment, imaged by high resolution laser confocal microscopy, scale bar represents 2.5 µm. Pink arrows indicate represented LDs. (D) LDs by Nile Red staining of fixed worms with dietary C18:1(n-9) or C17iso treatment. Yellow arrows indicate represented LDs. For all representative animals, anterior is left and posterior is right. Scale bar represents 5 µm. (E) The mean diameter of LDs quantified from five representative Nile Red–stained worms for each worm strain. The data are presented as mean ± SEM. Significant differences between the EV and a specific RNAi treatment: ***, P < 0.001. Significant differences between a specific dietary fatty acid treatment and not in same RNAi treatment: ###, P < 0.001.

