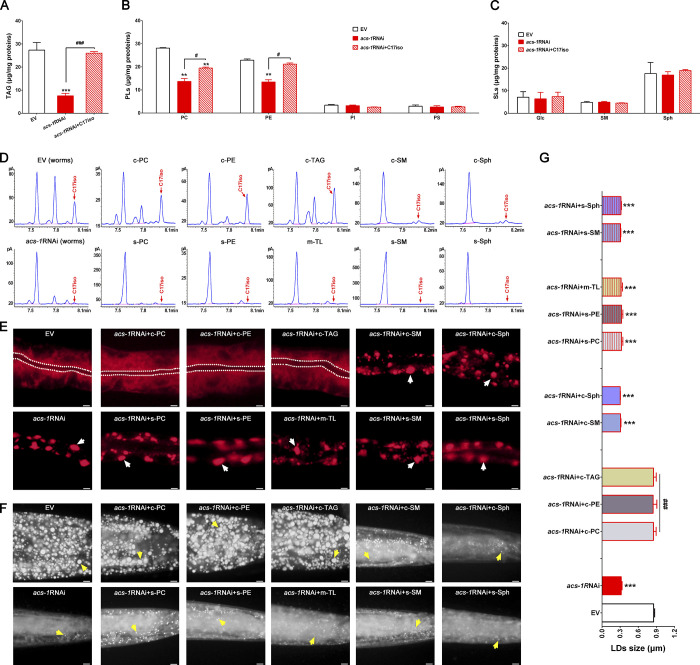
Figure 4.
Complex lipids containing C17iso determine ER integrity and LD growth. (A–C) The contents of TAG, PLs (PC, PE, PI, and PS), and SLs (Glc, SM, and Sph) analyzed by TLC-GC and further quantified by total proteins. The data are presented as mean ± SEM of three to four biological repeats. (D) GC analysis of C17iso in various complex lipids. Red arrows point to the C17iso peaks. (E) Visualization of ER morphology by mCherry::HDEL cultured with different complex lipids and imaged by fluorescent microscopy (Olympus); scale bar represents 5 µm. The white dashed lines indicate the lumen of worms, and the white arrows indicate the aggregation of the ER. (F) LDs by Nile Red staining of fixed worms cultured with different complex lipids. Yellow arrows indicate represented LDs; scale bar represents 5 µm. (G) The mean diameters of LDs quantified from five representative Nile Red–stained worms for each worm strain. For all representative animals, anterior is left and posterior is right. Significant differences between the EV and the acs-1RNAi with or without a specific dietary lipid treatment; **, P < 0.01; ***, P < 0.001. Significant differences between the acs-1RNAi without and with a specific dietary lipid treatment: #, P < 0.05; ###, P < 0.001. c, C. elegans; m, mouse liver; s, sigma.

