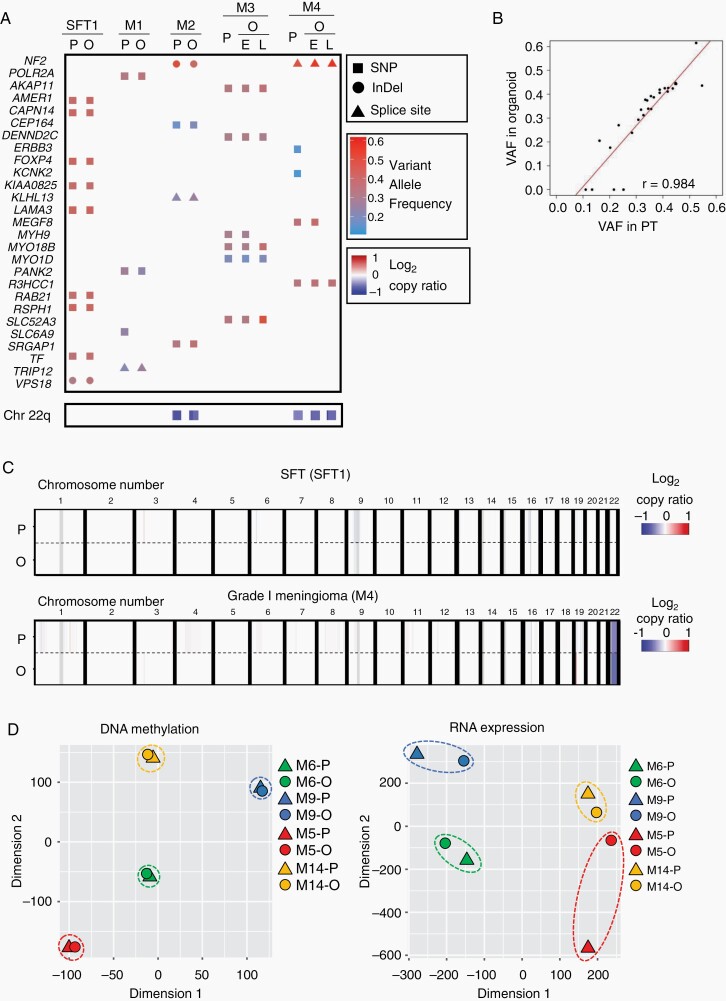
Fig. 2.
Meningioma and SFT organoids maintain genetic profiles of corresponding parental tumors. (A) Heatmap indicating somatic variants in SFT and meningioma-associated genes and a copy number variation in chromosome 22q identified by WES of the organoids (O) and corresponding parental tumors (P). In M3 and M4, E and L indicate data of organoids in their early-passages (M3; 1 passage and M4; 1 passage) or late-passages (M3; 23 passages and M4; 22 passages), respectively. Rectangles, circles, and triangles in the top panels represent single nucleotide polymorphisms (SNP), insertions or deletions (InDel), and mutations in splice site (Splice site), respectively, with the variant allele frequencies (VAFs). Blue colored rectangles in the bottom represent the relative copy numbers of chromosome 22q (Chr 22q) as indicated in log2-copy ratio. (B) Scatter plot indicating correlation of the VAFs of genetic mutations between the organoids and corresponding parental tumors. The x- or y-axis axis indicate VAF in parental tumors (PT) or organoids, respectively. (C) Structural variants in autosomal chromosomes of parental tumors (P) or organoids (O) of SFT1 and M4 (Grade I). (D) t-SNE plot indicating DNA methylation and RNA expression status of M5 (red), M9 (blue; Grade I), M6 (green), and M14 (yellow; Grade II). Circles or triangles indicate organoids (O) or parental tumors (P).

