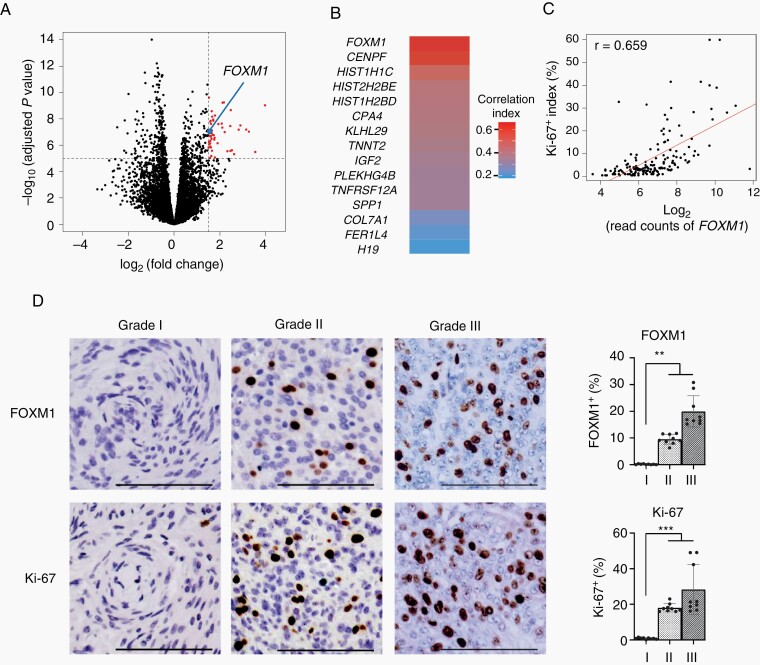
Fig. 3.
An upregulated expression of FOXM1 is associated with an increased meningioma proliferation. (A) Volcano plot illustrating the difference in gene expression between Grade I and Grades II and III meningiomas. Log2-fold change in gene expression values is plotted on the x-axis and calculated adjusted log10P values are plotted on the y-axis. Horizontal dotted line indicates −log10 (adjusted P value) = 5; vertical dotted line indicates log2 (fold change) = 1.5. A blue dot indicates FOXM1. (B) Heatmap indicating correlation index between Ki-67-positive scores and expression levels of 15 genes upregulated in malignant meningiomas. (C) Scatter plot illustrating the correlation between Ki-67 positive index and FOXM1 expression in meningioma tissues. The x-axis indicates log2-read counts of FOXM1. The y-axis indicates the Ki-67 positive index (%). (D) IHC images (left) using either anti-FOXM1 antibody (upper) or anti-Ki-67 antibody (lower) in Grades I, II, and III meningioma tissues. Bar graphs (right) indicating either FOXM1 or Ki-67 expression status. FOXM1 or Ki-67 positive indexes were calculated and averaged in three fields of IHC samples from three various cases of each grade. The average number of counted cells were 546 (FOXM1), or 592 (Ki-67) per field. The y-axis indicates either FOXM1 or Ki-67 positive index. Scale bars indicated 100 μm. Error bars indicate SD (**P < .05 or ***P < .01).

