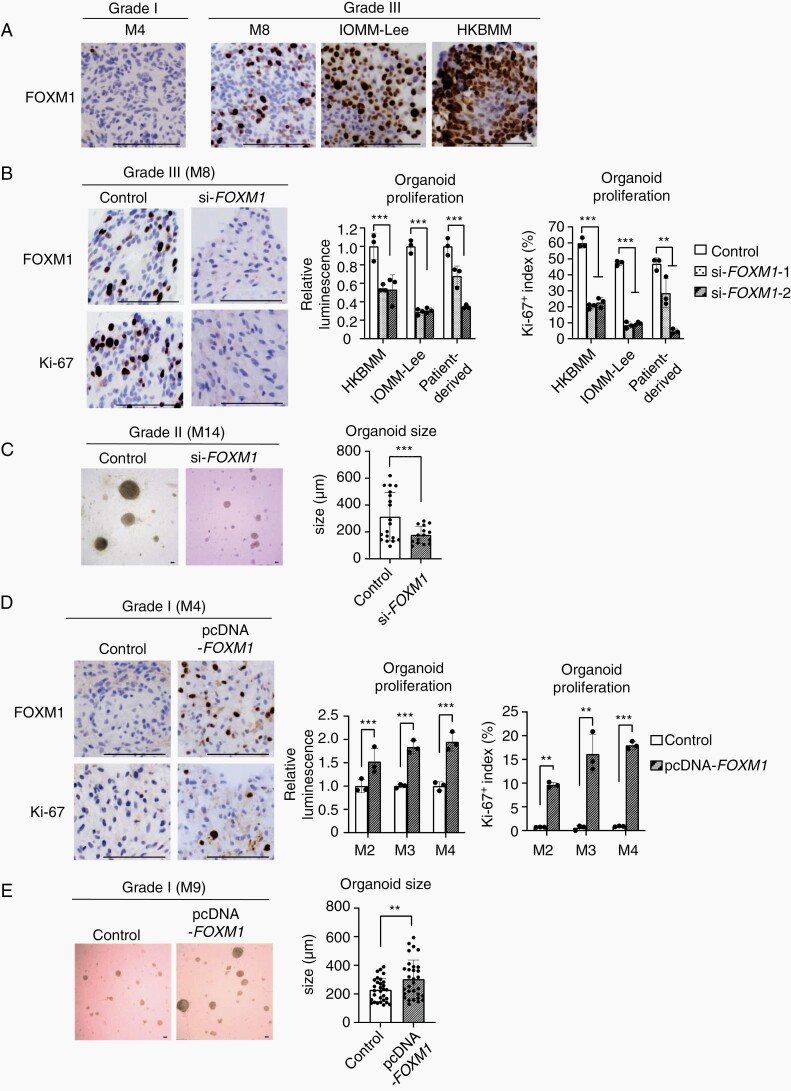
Fig. 4.
Altered FOXM1 expression status affected the proliferation of meningioma organoids. (A) IHC images using anti-FOXM1 antibody with the organoids of Grades I (M4) and III (M8), IOMM-Lee cells, or HKBMM cells. Scale bars indicate 100 μm. (B) IHC images (left) using anti-FOXM1 and anti-Ki-67 antibodies with Grade III organoid (M8) treated either with negative control siRNA or si-FOXM1. Scale bars indicate 100 μm. Bar graphs (right) indicating the cell viabilities or Ki-67 positive indexes. The Ki-67 positive indexes were averaged in three fields. The average number of counted cells were 200 per field. The y-axis indicates either relative luminescence to those of control or Ki-67 positive index (%). Error bars indicate SD (**P < .05 or ***P < .01). (C) Bright-field image (left) of organoid (M14; Grade II) treated either with negative control siRNA or si-FOXM1-2. Scale bars indicated 100 μm. Bar graphs (right) indicating average sizes of organoids treated with negative control siRNA or si-FOXM1-2. The organoid sizes were averaged in three fields. The y-axis indicates organoid sizes (μm). Error bars indicate SD (***P < .01). (D) IHC images (left) using anti-FOXM1 and anti-Ki-67 antibodies with Grade I organoid (M4) after transfection of either pcDNA3.0 or pcDNA3.0-FOXM1. Scale bars indicated 100 μm. Bar graphs (right) indicating the cell viabilities or Ki-67 positive indexes with these organoids. The Ki-67 positive indexes were averaged in three fields of IHC images. The y-axis indicates either relative luminescence to those of control or Ki-67 positive index (%). Error bars indicate SD (**P < .05 or ***P < .01). (E) Bright-field image (left) of organoid (M9; Grade I) after transfection of either pcDNA3.0 (Control) or pcDNA3.0-FOXM1. Scale bars indicate 100 μm. Bar graphs (right) indicating average sizes of organoids. The organoid sizes were averaged in three fields. The y-axis indicates organoid sizes (μm). Error bars indicate SD (**P < .05).

