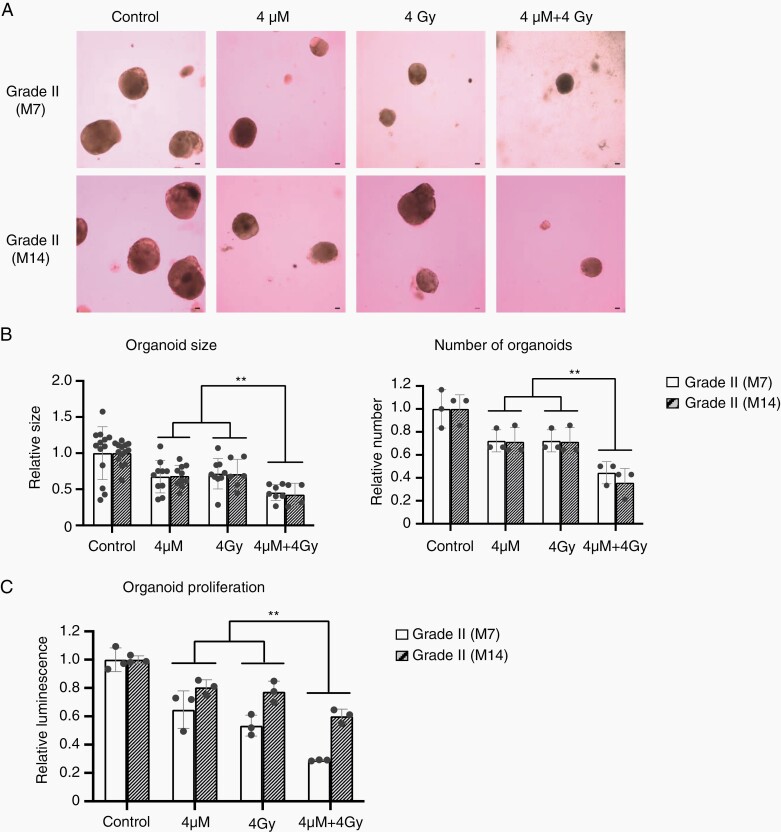
Fig. 5.
Radiation therapy and/or treatment with thiostrepton for meningioma organoid models. (A) Bright-field image of M7 (Grade II) and M14 (Grade II) organoids treated with radiation therapy (4 Gy) and/or thiostrepton (4 μM). Scale bars indicate 100 μm. (B) Bar graphs indicating average sizes or number of organoids (M7 and M14) treated with radiation therapy (4 Gy) and/or thiostrepton (4 μM). These data were averaged in three fields. The y-axis indicates relative organoid sizes or number to those of control. Error bars indicate SD (**P < .05). (C) Bar graphs indicating the cell viabilities of organoids (M7 and M14) treated with radiation therapy (4 Gy) and/or thiostrepton (4 μM). The y-axis indicates relative luminescence to those of control. Error bars indicate SD (**P < .05).

