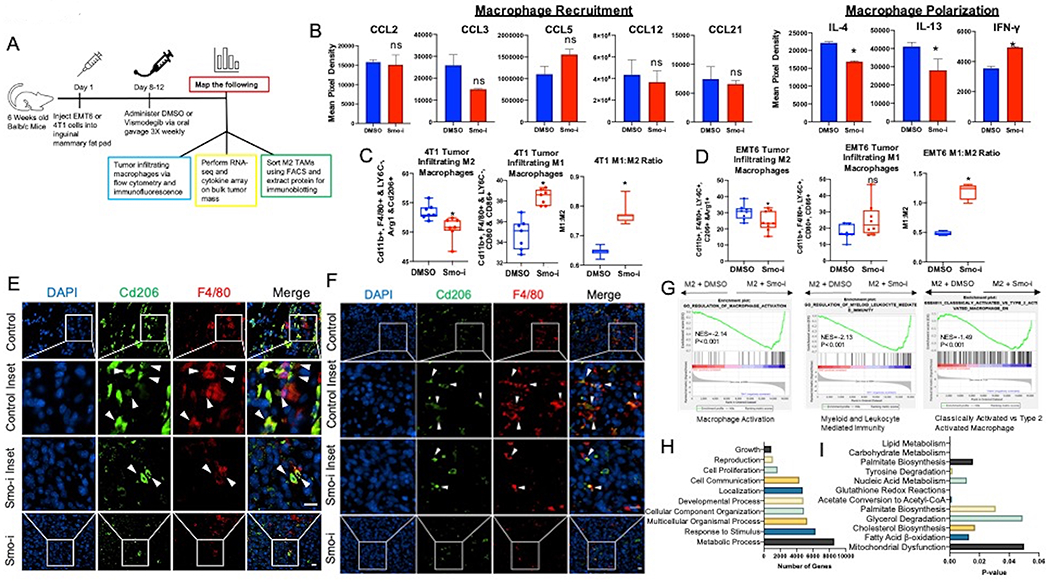
Figure 1. Hedgehog signaling blockade alters the tumor infiltrating macrophage polarization and metabolic processes.

A. Schematic of in vivo experimental timeline. B. Quantitative analysis of chemiluminescent intensity from the cytokine array measurements. (n = 4 per group). C,D. Quantitation of flow cytometric data from 4T1 (C) and EMT6 (D) tumors represented as % of tumor infiltrating TAMs. M2 macrophages are defined as Cd11b+, F4/80+ LY6C−, Arg1+ and Cd206+ populations, and M1 macrophages are defined as Cd11b+, F4/80+, LY6C−, Cd80+, Cd86+ populations (n = 7 per group). E, F. Immunofluorescent staining from 4T1 (E) and EMT6 (F) tumors for Cd206 (green), F4/80 (red), and DAPI (blue). White arrows point to M2 macrophages (F4/80+ Cd206+). Magnification bar is 15μm. G. GSEA Enrichment plots from RNA-seq of bulk 4T1 tumor mass depicting changes in macrophage related signatures. H,I. Pathway analysis of RNA-sequencing data shows top pathways based on number of relevant genes in (H) and top pathways based on significant p-value in (I). *P<0.05
