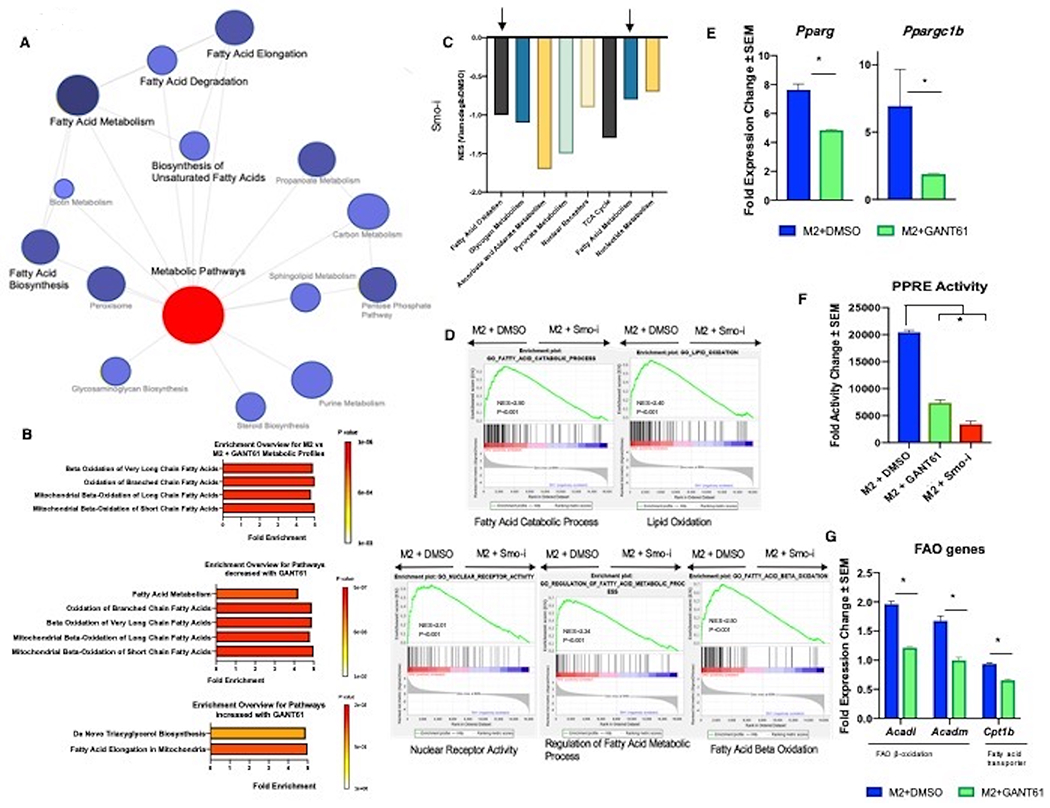
Figure 5. Hedgehog signaling blockade reduces transcriptional signatures of fatty acid oxidation.

A. PANTHER Network analyst yields a network of metabolic pathways that are differentially regulated in 4T1 tumors from mice treated with DMSO or Smo-i. B. Pathway enrichment score of metabolomics data. The graphs depict (Top) all pathways, (Middle) pathways that are downregulated with Hh inhibition, and (bottom) pathways that are upregulated with Hh inhibition. C. KEGG pathway analysis depicting metabolic pathways that are significantly downregulated in tumors from mice treated with DMSO or Smo-i. D. GSEA Enrichment plots from RNA-seq of RAW 264.7 cells skewed to M2 macrophages and inhibited for Hh signaling with GANT61. Normalized Enrichment Score (NES) and P-Value are depicted. E. Transcript levels of Pparg and Ppargc1b in BMDMs polarized to M2 macrophages +/− Hhi. F. PPARγ activity in RAW 264.7 cells polarized to M2 macrophages +/− Hhi. G. Transcript levels of FAO genes in BMDMs polarized to M2 +/− Hhi. *P<0.05
