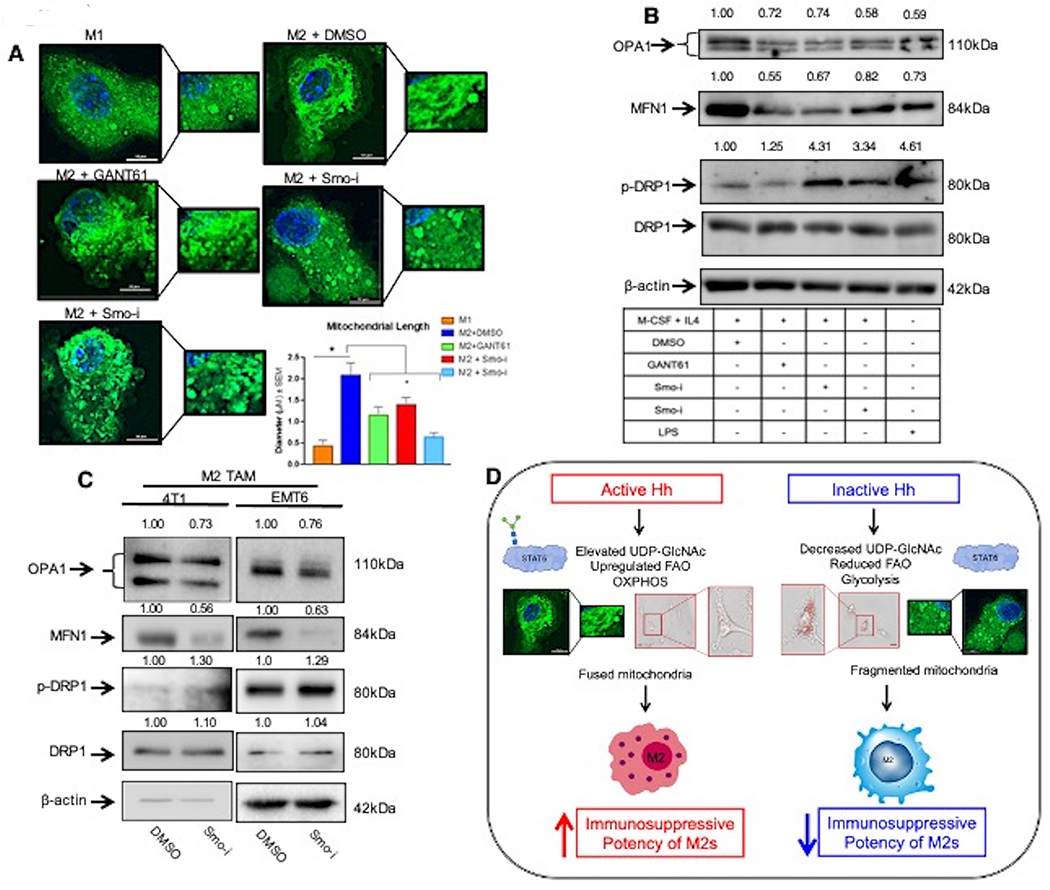
Figure 8. Inhibition of Hh/GLI signaling alters mitochondrial morphology in M2 macrophages.

A. Macrophages were stained with Mitotracker Green and visualized via confocal imaging. Scale bar represents 10 μm. Quantitation was performed using NIS Elements. B. Western Blot for fusion (OPA1, MFN1) and fission (p-DRP1, DRP1) related proteins in BMDMs skewed to M1 or M2 macrophages +/− Hhi. C. F4/80hi Cd206hi tumor infiltrating (M2) macrophages were sorted from 4T1 and EMT6 mammary tumors from mice treated with Smo-i or vehicle control and immunoblotted for mitochondrial fusion and fission proteins. These lysates were also used for data depicted in Figure 3F. As such the same image for β-actin loading control is used. D. Schematic highlighting the role of Hh signaling in altering macrophage metabolism. Parts of this schematic were made using BioRender *P<0.05
