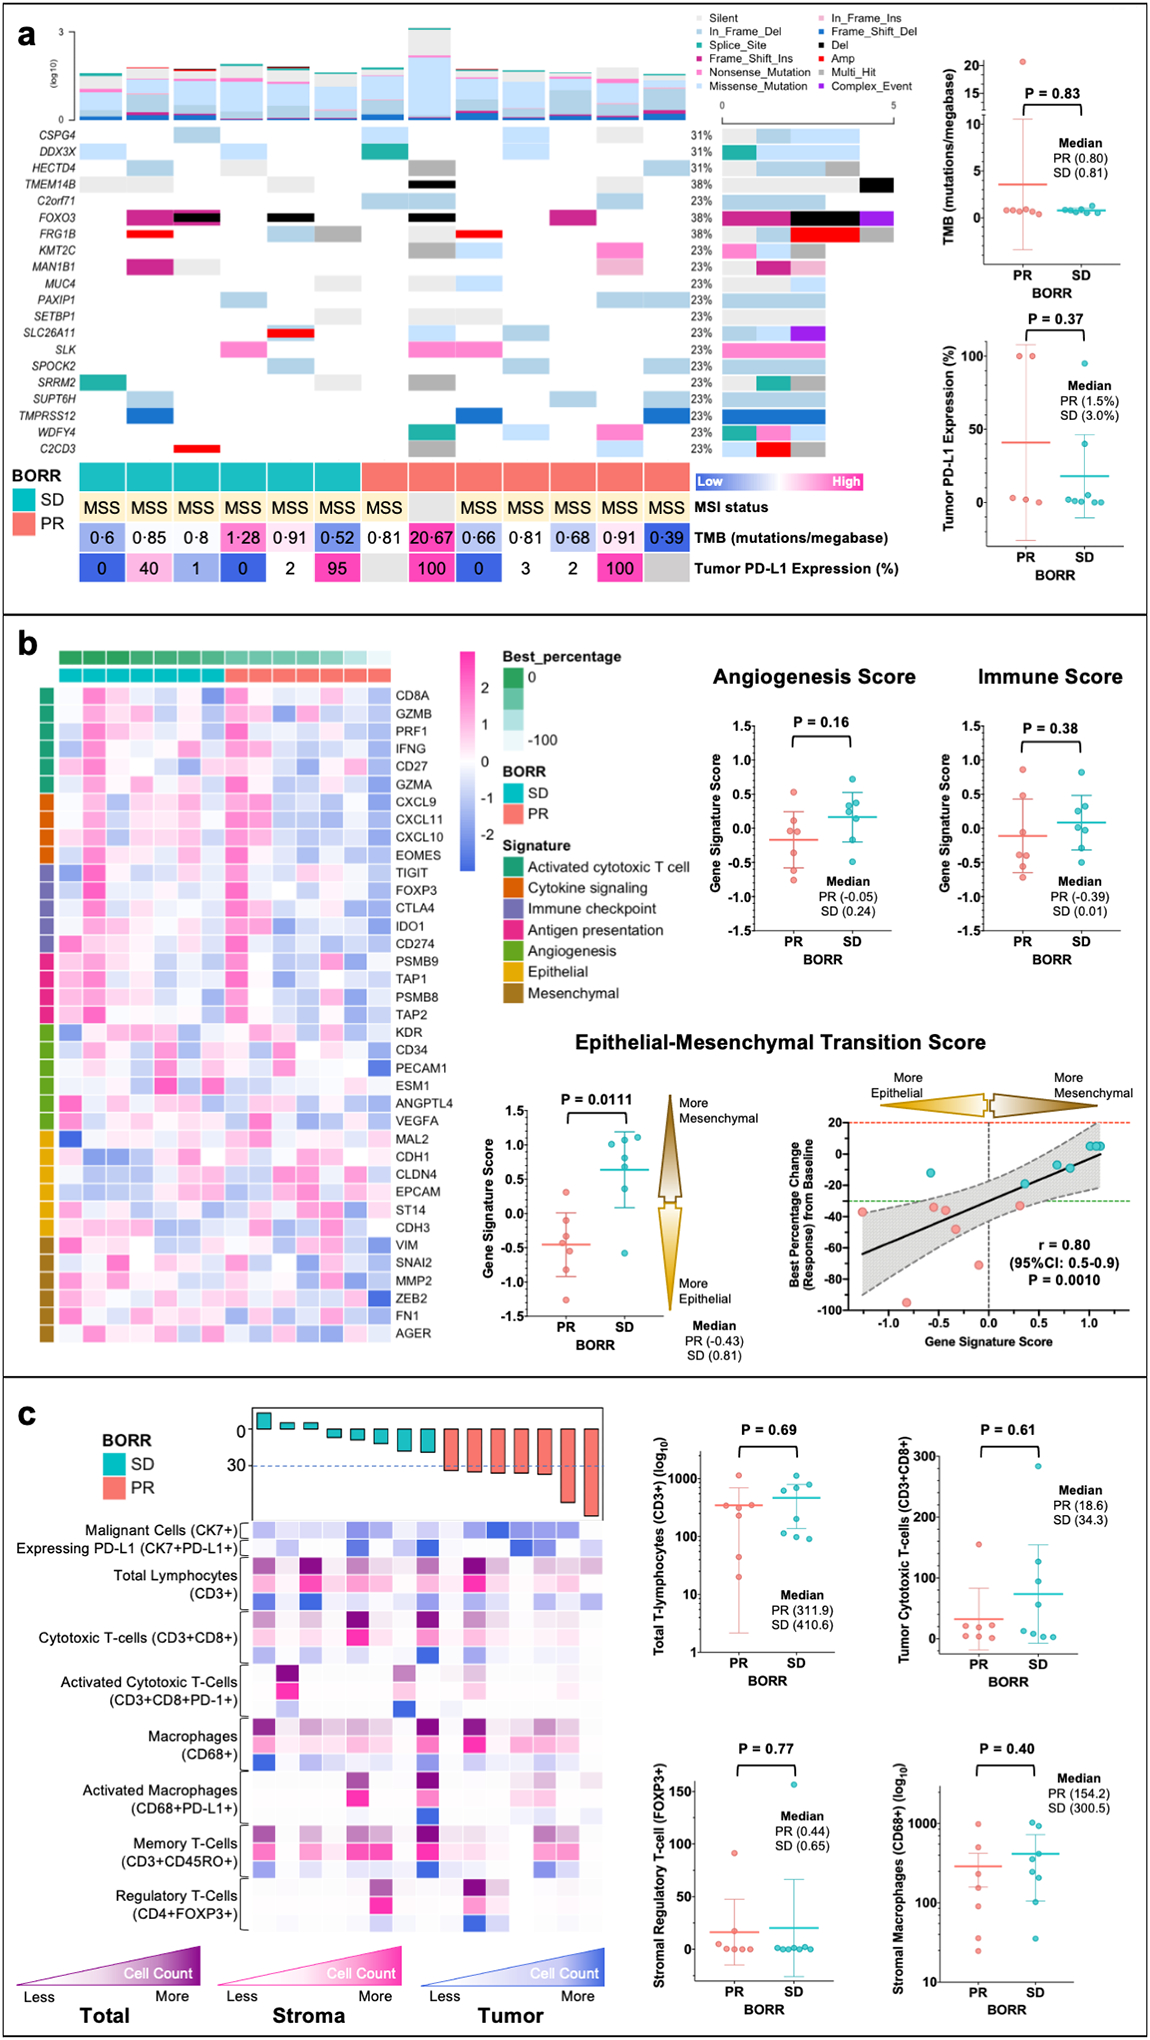
Figure 2. Exploratory Biomarker Analyses of Pre-treatment Tumor Tissue Samples for Patients with Malignant Peritoneal Mesothelioma (MPeM) Treated with Atezolizumab and Bevacizumab (AtezoBev) on Study.

Tissue samples underwent immunohistochemistry (IHC), whole-exome (WES) and RNA sequencing (RNAseq) and multiplex immunofluorescence (mIF) with rigorous quality check. Mechanistically relevant biomarkers were evaluated and compared between responders (PR) and non-responders (SD) using heatmaps (columns representing patients and rows representing gene/cell type) and scatter dot plots (all plots show each patient with line at mean and whiskers at 95%CI). Panel a shows oncoplot with 20 most common genes altered in patients on trial. Patients are arranged in order of best percentage change (response) in tumor measurements from baseline (from left to right: increase to decrease) as per RECISTv1.1 (Response Evaluation Criteria in Solid Tumors - version 1.1). The color bar at bottom shows response for each patient (PR [responder] and SD [non-responder with stable disease]). The barplot on top and right show number of mutations (log) for each patient and frequency of mutations for each gene in all patients, respectively. Panel b shows pre-treatment tumor gene signature analyses as per gene signatures defining immune biology, angiogenesis and epithelial-mesenchymal transition (EMT). The figure panel also shows strong correlation between EMT gene signature score and degree of response to AtezoBev per RECISTv1.1. Panel c illustrates the immune milieu (tumor, stroma, and total) of tumors sections at baseline using multiplex immunofluorescence. No specific cell types (key cell types shown in figure) prior to treatment were found to be associated response with AtezoBev.
