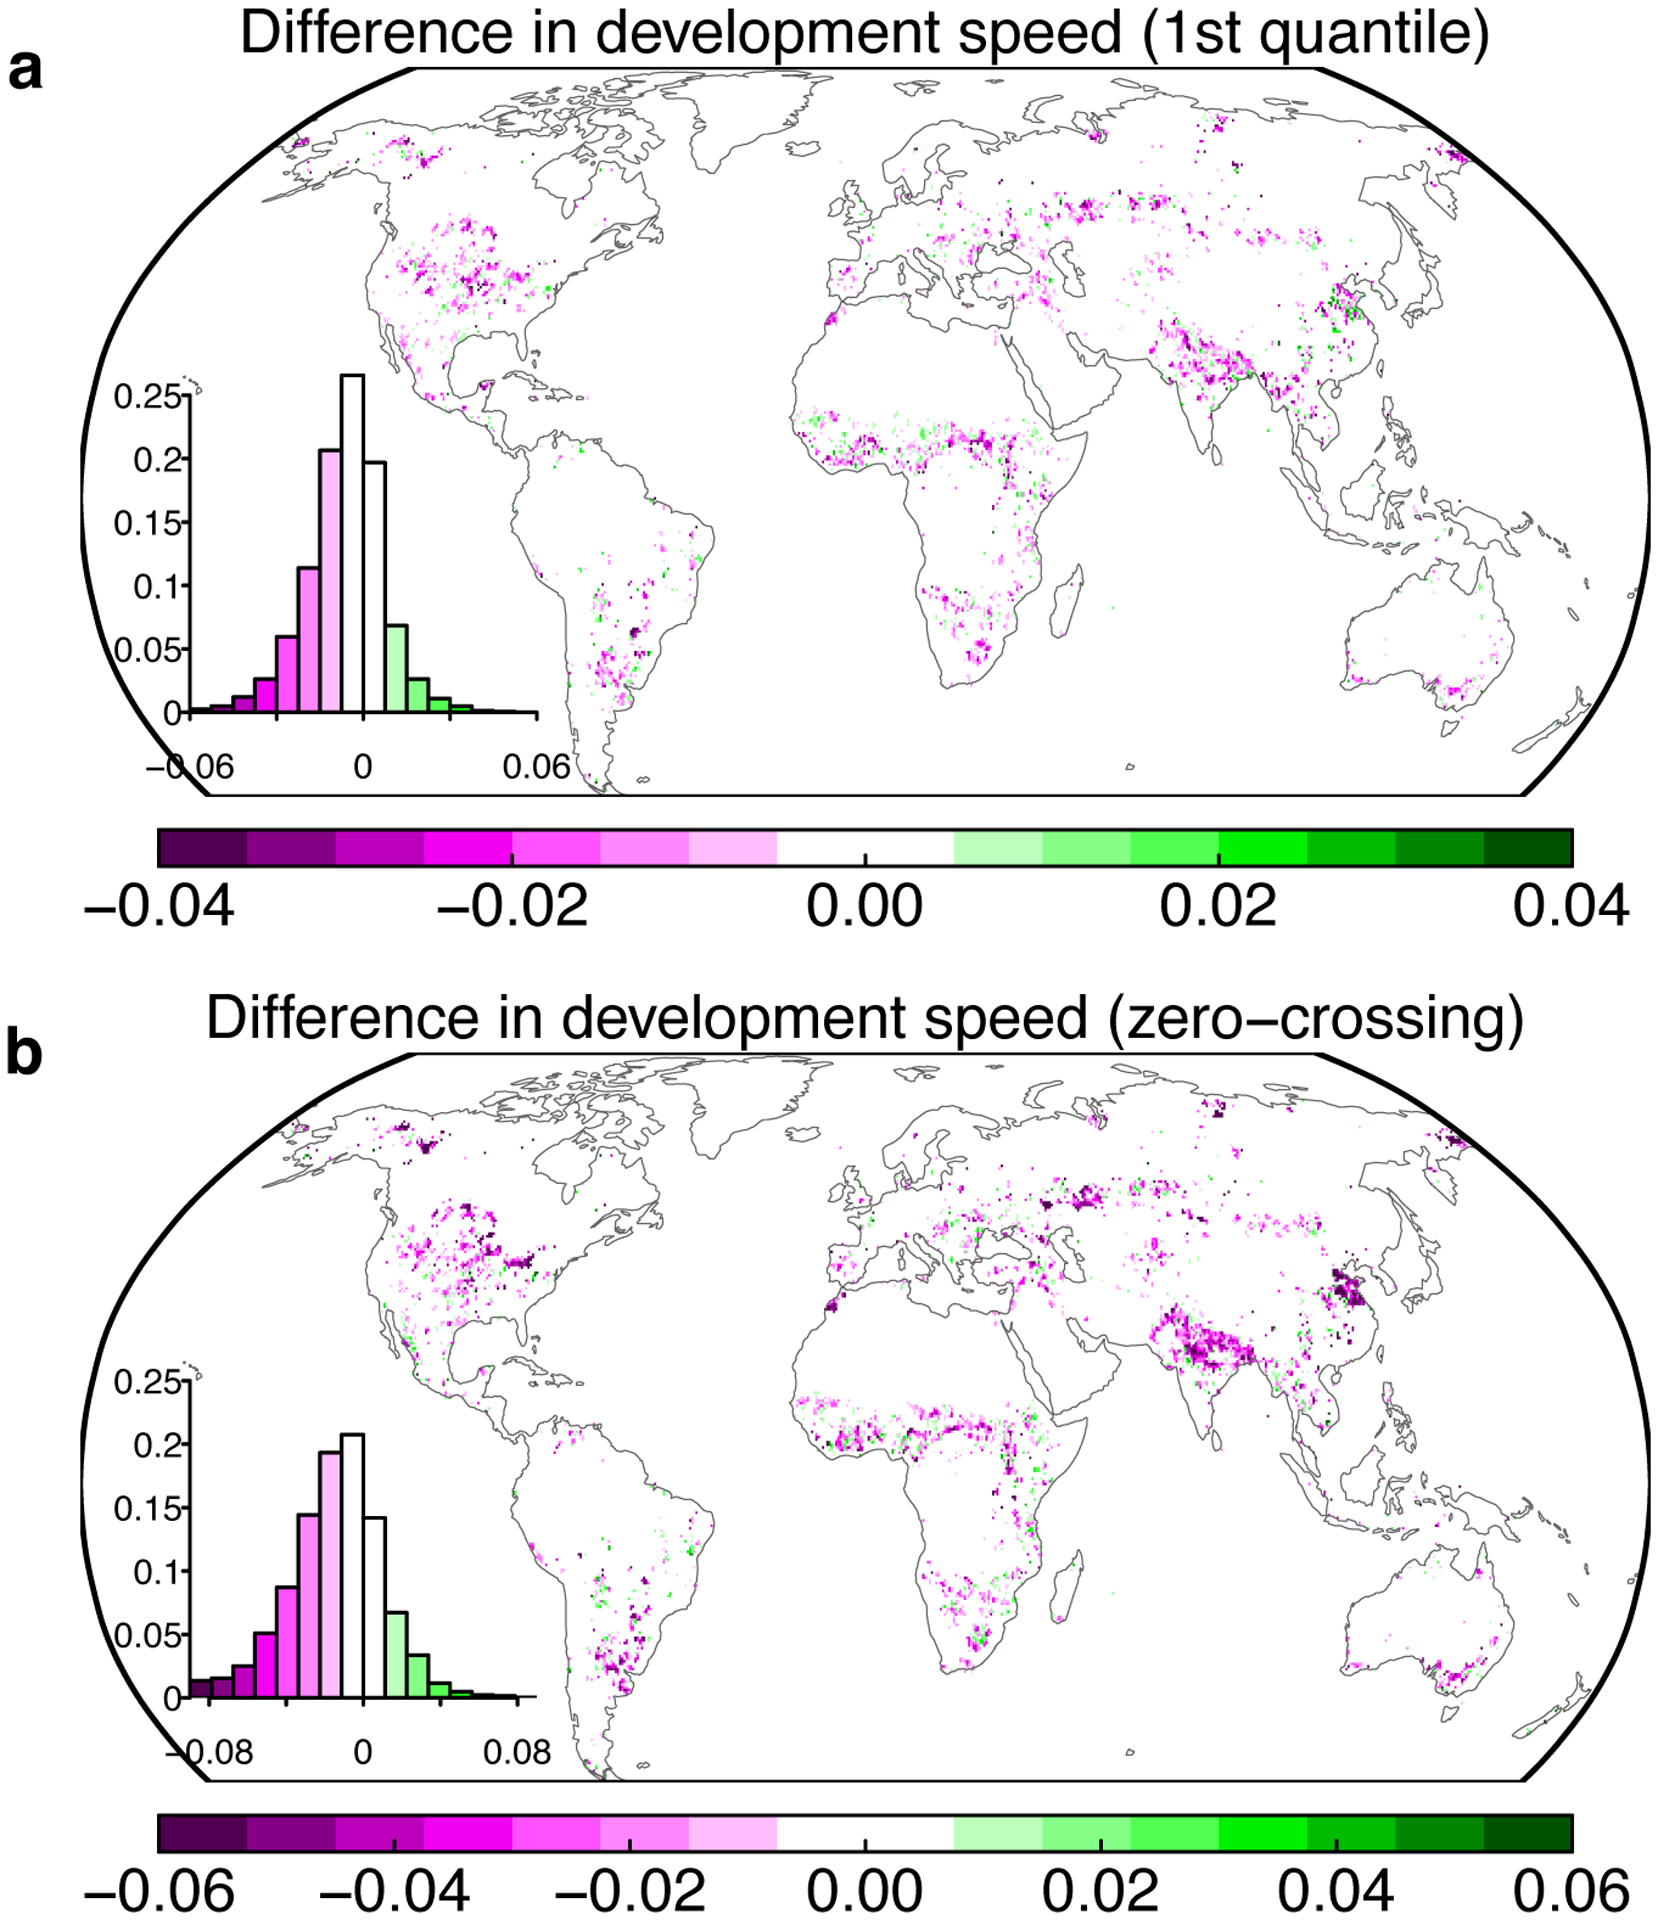
Extended Data Fig. 6. Comparisons of the development speed of drought impact between overshoot and non-overshoot drought events.

a The development speed is calculated as the 1st quantile value of the NDVI changes during the start of the decline to the minimum of the de-seasonalized detrended NDVI anomalies for each drought event. b Same as a, but using the change of NDVI at the zero-crossing date based on the de-seasonalized detrended NDVI anomalies. Insets show the histogram of the development speed.
