. 2021 Aug 18;27(21):6001–6011. doi: 10.1158/1078-0432.CCR-21-1819

Figure 5.

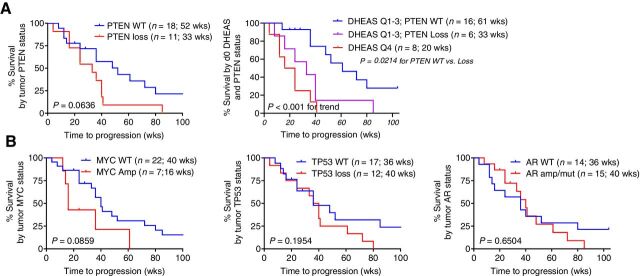
Figure 5. Association of PTEN status with radiographic progression on AA plus prednisone. A, rPFS as a function of PTEN status alone or as a function of baseline serum DHEAS levels stratified by PTEN status, comparing subjects in the lowest vs highest three quartiles (Q4 vs Q1–3). B, rPFS as a function of MYC, TP53, or AR status.

Association of PTEN status with radiographic progression on AA plus prednisone. A, rPFS as a function of PTEN status alone or as a function of baseline serum DHEAS levels stratified by PTEN status, comparing subjects in the lowest vs highest three quartiles (Q4 vs Q1–3). B, rPFS as a function of MYC, TP53, or AR status.