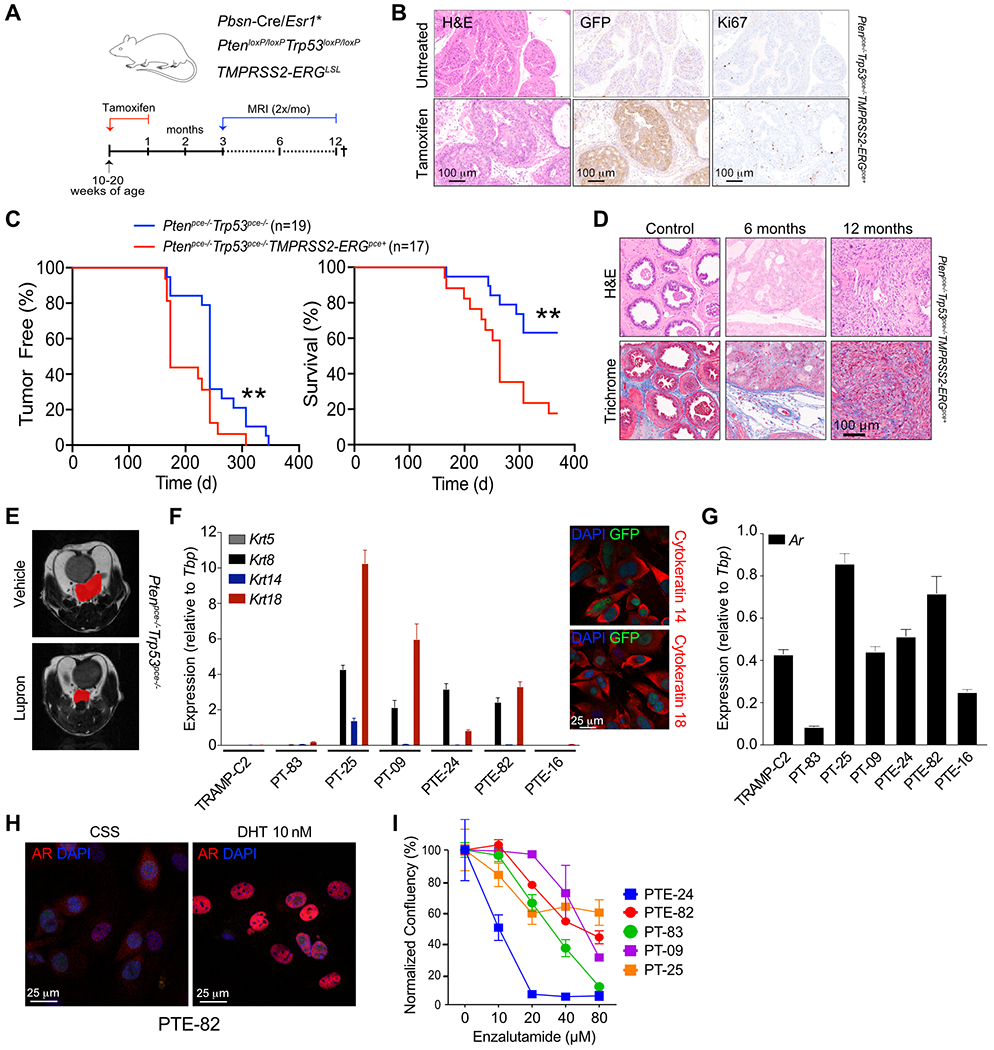
Figure 1. Development of syngeneic mouse models representing CRPC.

A) Mouse model scheme. B) Tamoxifen induced GFP and Ki67 expression in prostate glands of a Ptenpce−/−/Trp53pce−/−/TMPRSS2-ERGpce+ mouse after 2 month of tamoxifen administration, n=1. C) Detection of prostate tumors and overall survival in Ptenpce−/−/Trp53pce−/− and Ptenpce−/−/Trp53pce−/−/TMPRSS2-ERGpce+ mice. Days reflect time post tamoxifen administration. Tumor incidence and size were monitored by monthly MRI starting at 5-6 months. n=17-19 mice, pooled from two independent cohorts. Significance between the two groups was determined by log-rank. D) Hematoxylin and eosin (H&E) and Masson’s trichrome staining in Ptenpce−/−/Trp53pce−/−/TMPRSS2-ERGpce+ mice from C. Control prostate glands were harvested from mice at 6 and 12 months of age. E) Representative T2-weighted image by MRI of tumor lesion-bearing Ptenpce−/−/Trp53pce−/− mice treated with vehicle or 0.6 mg Lupron subcutaneously every 28 days for two cycles, starting 4 months after tamoxifen administration. n=3-5 mice per group, data from a one cohort of mice. F) Expression of Krt5, Krt8, Krt14, Krt18 in the different cell lines generated from either Ptenpce−/−/Trp53pce−/− (PT) or Ptenpce−/−/Trp53pce−/−/TMPRSS2-ERGpce+ (PTE) mice at end-stage. n=6 from one cohort, with data shown as the mean ± SEM. TRAMP-C2 cell line was used as a comparison. Representative confocal microscopy immunofluorescent images of the PTE-82 cell line stained for cytokeratin 14 and cytokeratin 18 are shown to the right. Similar results were obtained for the PT-09, PT-25, and PTE-24 lines. Images represent one of two independent experiments. G) Expression of Ar in the different cell lines. n=6 from one cohort, data shown as the mean ± SEM. H) Confocal microscopy immunofluorescent images of the PTE-82 cell line either treated with 10 nM DHT or left untreated in charcoal stripped serum (CSS). Androgen receptor (red) and DAPI (blue). Images are representative of one of three independent experiments. I) Dose response curve of enzalutamide in 5 different prostate cancer cell lines. Phase contrast images were acquired at 8 hr intervals using Incucyte, with confluence per well calculated per cell line. n=3, data shown as the mean ± SEM from one of at least three independent experiments.
