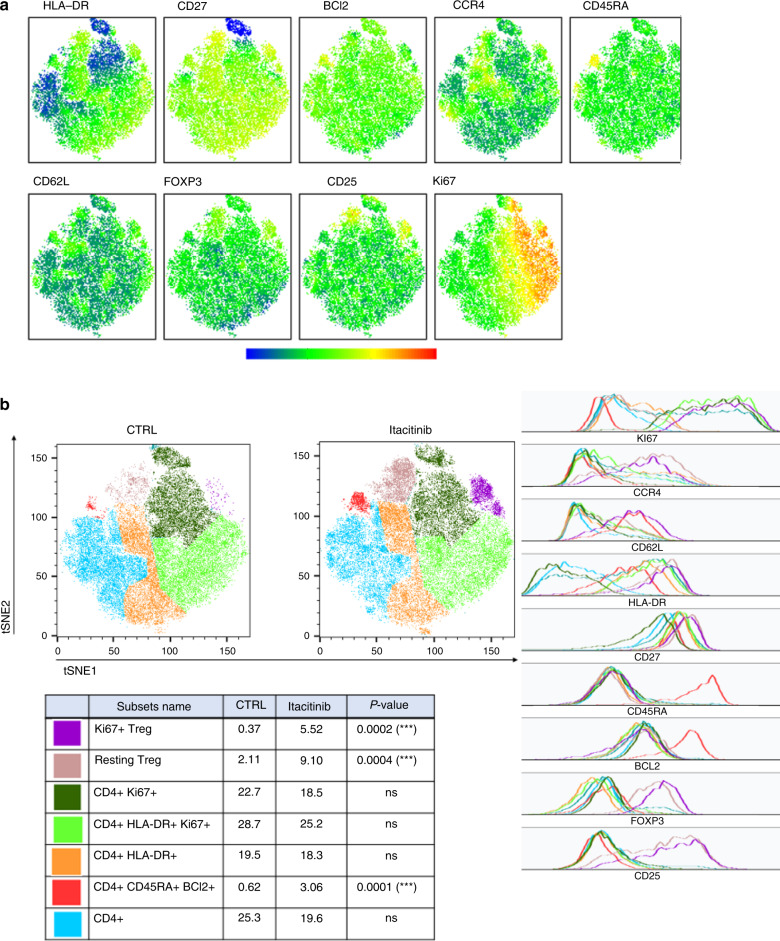
Fig. 2. T-SNE of CD4+ T cells in peripheral blood from mice in cohort 3 on day 28 after transplantation.
T-SNE were created on 20,135 CD4+ T cells and included HLA-DR, CD27, BCl2, CCR4, CD45RA, CD62L, FOXP3, CD25, and Ki67 markers. a Visualization of marker expression (MFI) among CD4+ T cells. b Seven populations were determined based on different marker expressions (geometric mean), i.e., Treg Ki67+ (purple), resting Treg (beige), CD4+ Ki67+ (dark green), CD4+HLA-DR+Ki67+ (light green), CD4+HLA-DR+ (orange), CD4+CD45RA+BCl2+ (red), and other CD4+ (blue) in the control and the itacitinib groups. Ki67+ Treg (purple, P = 0.0002), resting Treg (beige, P = 0.0004) and CD4+CD45RA+BCl2+ T cells (red, P = 0.0001) were increased in the treated group at day 28 in the cohort 3. Histograms show marker expression in subpopulations.

