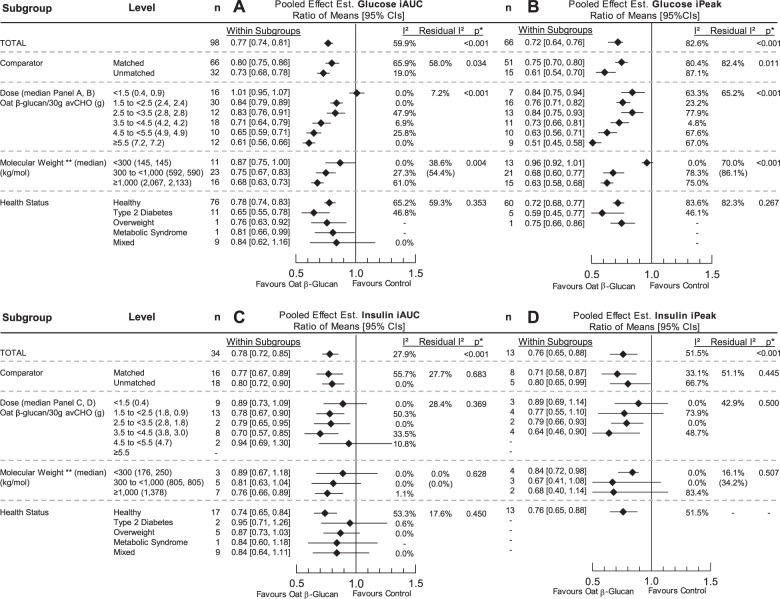
Fig. 1. Effect of oat β-glucan on postprandial glycaemic and insulinaemic responses.
Pooled effect estimates of the effect of oat β-glucan on the incremental area under the curve (iAUC) for blood glucose (A), incremental peak rise (iPeak) for blood glucose (B), iAUC insulin (C), and iPeak insulin (D). Pooled effect estimates are expressed as ratios of means (RoMs, black diamond) with 95% CIs (solid lines). Pooled analyses were conducted using the generic inverse variance method with random effects models. Interstudy heterogeneity was tested by the Cochran Q statistic (χ2) at a significance level of PQ < 0.10 (not shown) and quantified by I2. The residual I2 value represents unexplained heterogeneity for each subgroup. n, number of trial comparisons. *Differences between subgroups were tested using meta-regression and the significance level was reported as a p value, where p < 0.05 was considered significant.

