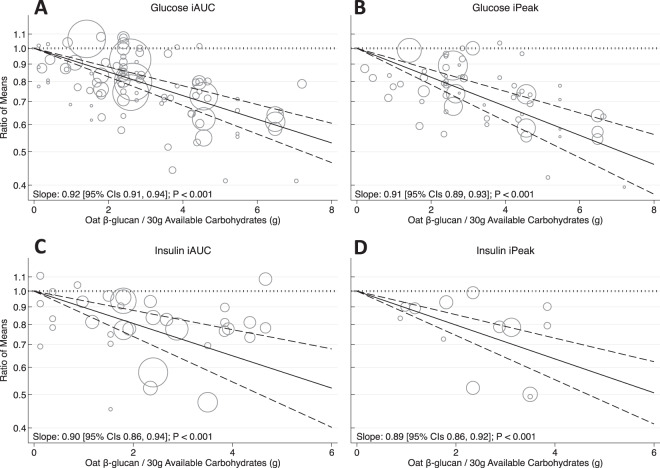
Fig. 2. Effect of oat β-glucan dose on postprandial glycaemic and insulinaemic responses.
Pooled dose-response relationship between oat β-glucan and incremental area under the curve (iAUC) for blood glucose (A), incremental peak rise (iPeak) for blood glucose (B), iAUC insulin (C), and iPeak insulin (D). Changes in the outcomes (y-axis) are presented as ratios of means (RoMs). Oat β-glucan dose is presented on a 1 g/30 g available carbohydrate scale. Individual comparisons are represented by the circles, with the weight of the study in the overall analysis represented by the size of the circles. The central straight line represents the fitted dose response estimate with outer dashed lines representing the 95% confidence intervals (CIs), which was modelled using one-stage random effects with the generic inverse variance and restricted maximum likelihood methods, assuming a linear function.

