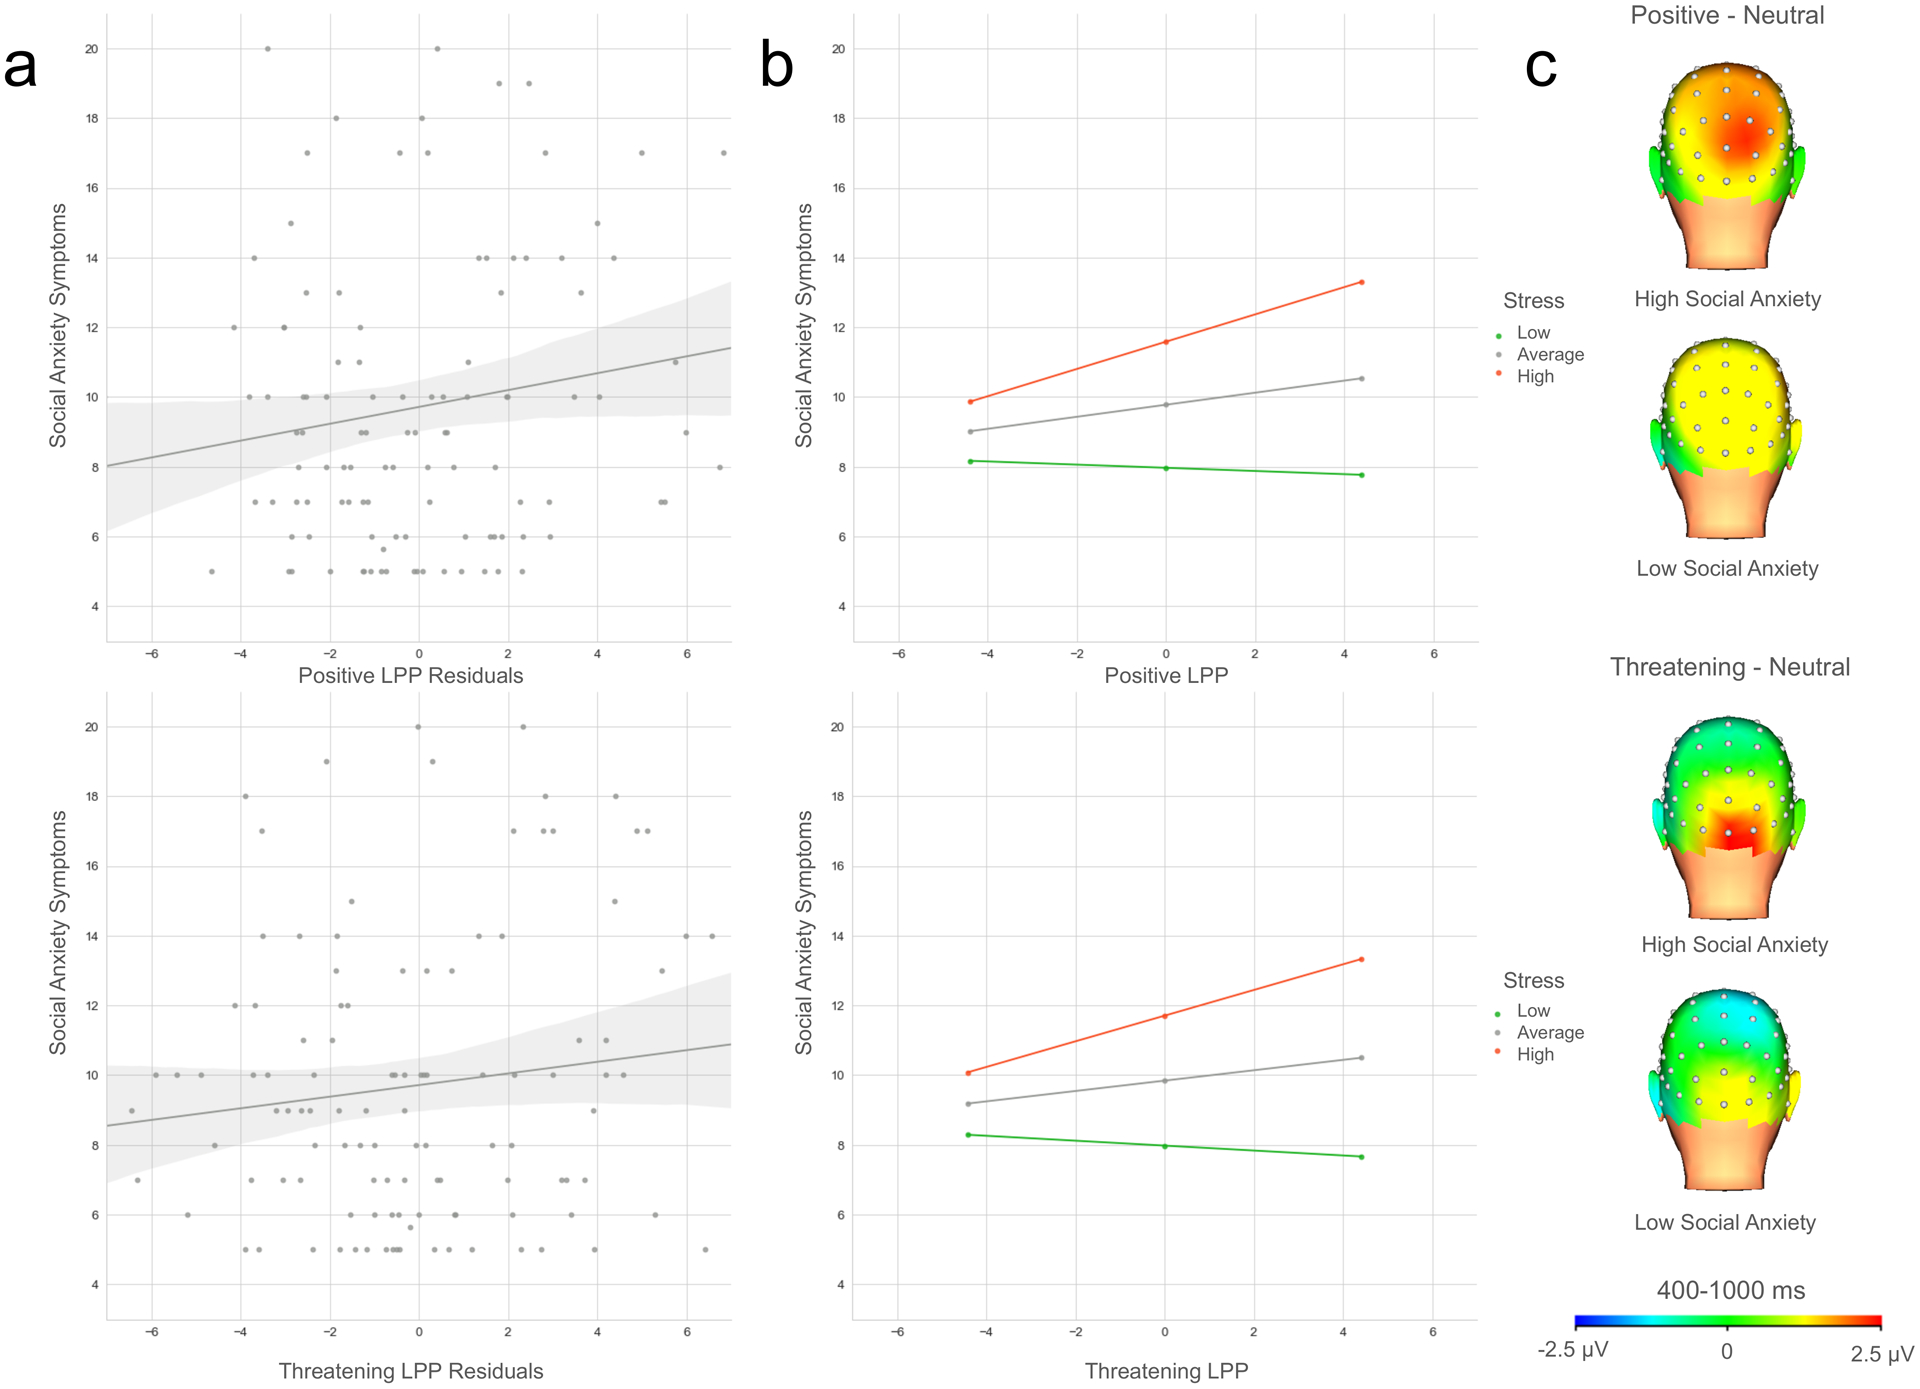
Figure 3.

a) Scatterplots depicting the overall association between LPP residuals to positive (top) and threatening (bottom) images and social anxiety symptom levels. b) Plots of the simple slopes for the interaction effect between LPP to positive (top) and threatening (bottom) stimuli at low, average, and high levels of chronic interpersonal stress (note: low, average, and high represent −1 SD, mean, and +1 SD). c) Scalp distributions depicting the LPP for participants above the Johnson-Neyman region of significance threshold for stress with high and low levels of social anxiety (note: the median split for high and low social anxiety symptom levels was used for illustrative purposes only; the primary analyses used social anxiety symptoms as a continuous variable).
