. 2021 Aug 20;81(21):5523–5539. doi: 10.1158/0008-5472.CAN-21-0897

Figure 4.

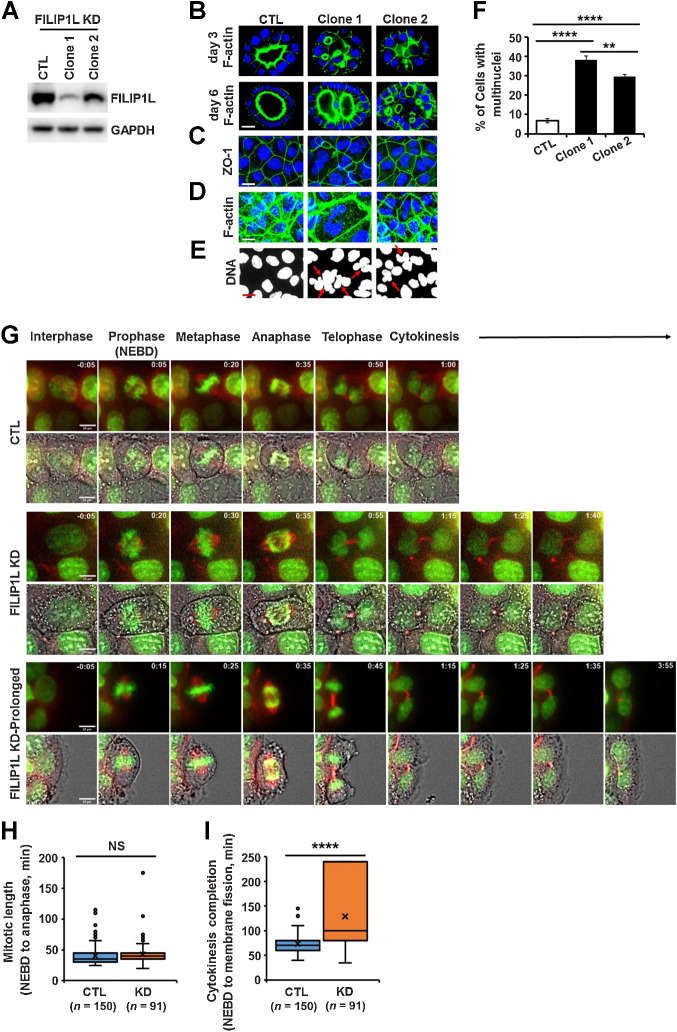
Figure 4. FILIP1L knockdown results in defective cytokinesis. A, FILIP1L knockdown was achieved by CRISPR-Cas9 system in MDCK.2 cells. FILIP1L and GAPDH control were detected by immunoblotting. Two independent clones were tested. B, MDCK.2 clones were grown in the presence of Matrigel, and three-dimensional cysts were imaged following staining for F-actin and nuclei at days 3 and 6. C–F, MDCK.2 clones were grown in monolayer and stained for Z0–1 (C), F-actin (D), and DNA (E). F, Clones were stained for Z0–1 and DNA, and the number of cells with multinuclei were quantified. Over 400 cells were counted. G–I, Time-lapse imaging of Caco2 clones that were incubated with SPY-595 DNA and SPY-650-tubulin fluorescent dyes. G, Representative tiled images of mitotic progression in control and FILIP1L knockdown clones. FILIP1L knockdown clones exhibiting prolonged cytokinesis are also shown (third panel). Within each panel of tiled images, the top strip shows fluorescent images only and the bottom strip shows fluorescent images overlaid with phase contrast. Scale bar, 20 μm. H and I, Mitotic length (H) and cytokinesis completion (I) from control and FILIP1L knockdown clones were quantified from three independent experiments. **, P < 0.01; ****, P < 0.0001; NS, nonsignificant.

FILIP1L knockdown results in defective cytokinesis. A, FILIP1L knockdown was achieved by CRISPR-Cas9 system in MDCK.2 cells. FILIP1L and GAPDH control were detected by immunoblotting. Two independent clones were tested. B, MDCK.2 clones were grown in the presence of Matrigel, and three-dimensional cysts were imaged following staining for F-actin and nuclei at days 3 and 6. C–F, MDCK.2 clones were grown in monolayer and stained for Z0–1 (C), F-actin (D), and DNA (E). F, Clones were stained for Z0–1 and DNA, and the number of cells with multinuclei were quantified. Over 400 cells were counted. G–I, Time-lapse imaging of Caco2 clones that were incubated with SPY-595 DNA and SPY-650-tubulin fluorescent dyes. G, Representative tiled images of mitotic progression in control and FILIP1L knockdown clones. FILIP1L knockdown clones exhibiting prolonged cytokinesis are also shown (third panel). Within each panel of tiled images, the top strip shows fluorescent images only and the bottom strip shows fluorescent images overlaid with phase contrast. Scale bar, 20 μm. H and I, Mitotic length (H) and cytokinesis completion (I) from control and FILIP1L knockdown clones were quantified from three independent experiments. **, P < 0.01; ****, P < 0.0001; NS, nonsignificant.