. 2021 Aug 20;81(21):5523–5539. doi: 10.1158/0008-5472.CAN-21-0897

Figure 7.

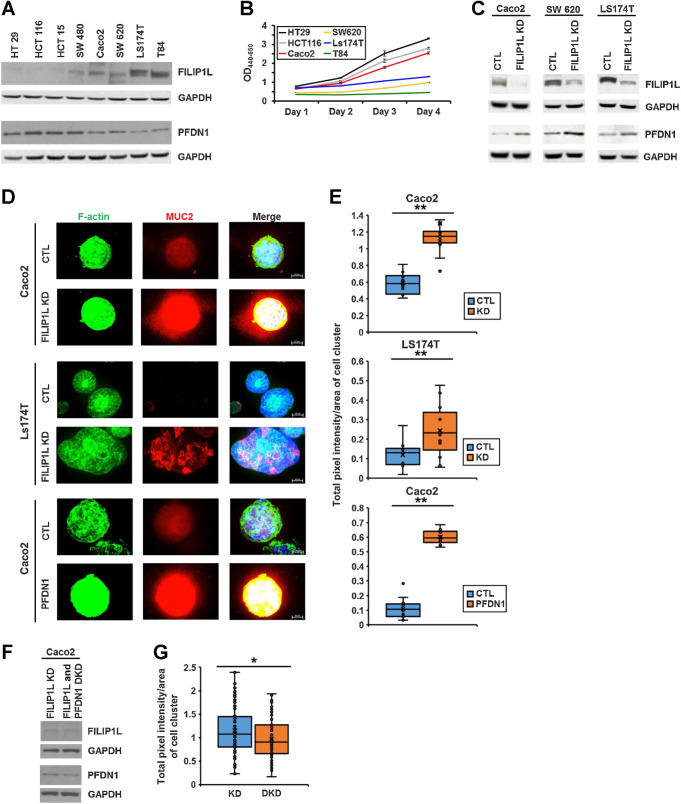
Figure 7. FILIP1L knockdown induces mucin secretion in colon cancer cells. A, Protein levels of FILIP1L and PFDN1 were determined by immunoblotting in various colon cancer cell lines. B, Cell proliferation of various colon cancer cell lines was measured by WST1 incorporation daily for 4 days. The y-axis represents absorbance that was subtracted OD650 nm from OD440 nm. C, FILIP1L knockdown was achieved by stable expression of lentiviral shRNA in FILIP1L-high Caco2, SW620, and Ls174T colon cancer cells. Control clones were made with scrambled shRNA. FILIP1L, PFDN1, and GAPDH control were detected by immunoblotting. By densitometric quantification, FILIP1L protein was decreased by 11-, 3.6-, and 3.5-fold in Caco2, SW620, and Ls174T clones compared with their corresponding controls, respectively. D and E, Clones from either control or FILIP1L knockdown (Caco2 and Ls174T clones) as well as those from either control or PFDN1 overexpression (Caco2 clones) were grown in the presence of Matrigel, and three-dimensional clusters were stained for F-actin (green), MUC2 (red), and DAPI (blue; D), and the total fluorescence intensity per area of cell cluster was quantified (E). Ten to 15 cell clusters were counted. Scale bar, 20 μm. F, PFDN1 knockdown was achieved by stable expression of lentiviral shRNA in FILIP1L-knockdown Caco2 clones. FILIP1L, PFDN1, and GAPDH control were detected by immunoblotting. By densitometric quantification, PFDN1 protein was decreased by 2.1-fold in FILIP1L/PFDN1 double knockdown clones compared with FILIP1L knockdown clones. G, Caco2 clones from either FILIP1L knockdown or FILIP1L/PFDN1 double knockdown were analyzed for MUC2 total fluorescence intensity as described in E. *, P < 0.05; **, P < 0.01.

FILIP1L knockdown induces mucin secretion in colon cancer cells. A, Protein levels of FILIP1L and PFDN1 were determined by immunoblotting in various colon cancer cell lines. B, Cell proliferation of various colon cancer cell lines was measured by WST1 incorporation daily for 4 days. The y-axis represents absorbance that was subtracted OD650 nm from OD440 nm. C, FILIP1L knockdown was achieved by stable expression of lentiviral shRNA in FILIP1L-high Caco2, SW620, and Ls174T colon cancer cells. Control clones were made with scrambled shRNA. FILIP1L, PFDN1, and GAPDH control were detected by immunoblotting. By densitometric quantification, FILIP1L protein was decreased by 11-, 3.6-, and 3.5-fold in Caco2, SW620, and Ls174T clones compared with their corresponding controls, respectively. D and E, Clones from either control or FILIP1L knockdown (Caco2 and Ls174T clones) as well as those from either control or PFDN1 overexpression (Caco2 clones) were grown in the presence of Matrigel, and three-dimensional clusters were stained for F-actin (green), MUC2 (red), and DAPI (blue; D), and the total fluorescence intensity per area of cell cluster was quantified (E). Ten to 15 cell clusters were counted. Scale bar, 20 μm. F, PFDN1 knockdown was achieved by stable expression of lentiviral shRNA in FILIP1L-knockdown Caco2 clones. FILIP1L, PFDN1, and GAPDH control were detected by immunoblotting. By densitometric quantification, PFDN1 protein was decreased by 2.1-fold in FILIP1L/PFDN1 double knockdown clones compared with FILIP1L knockdown clones. G, Caco2 clones from either FILIP1L knockdown or FILIP1L/PFDN1 double knockdown were analyzed for MUC2 total fluorescence intensity as described in E. *, P < 0.05; **, P < 0.01.