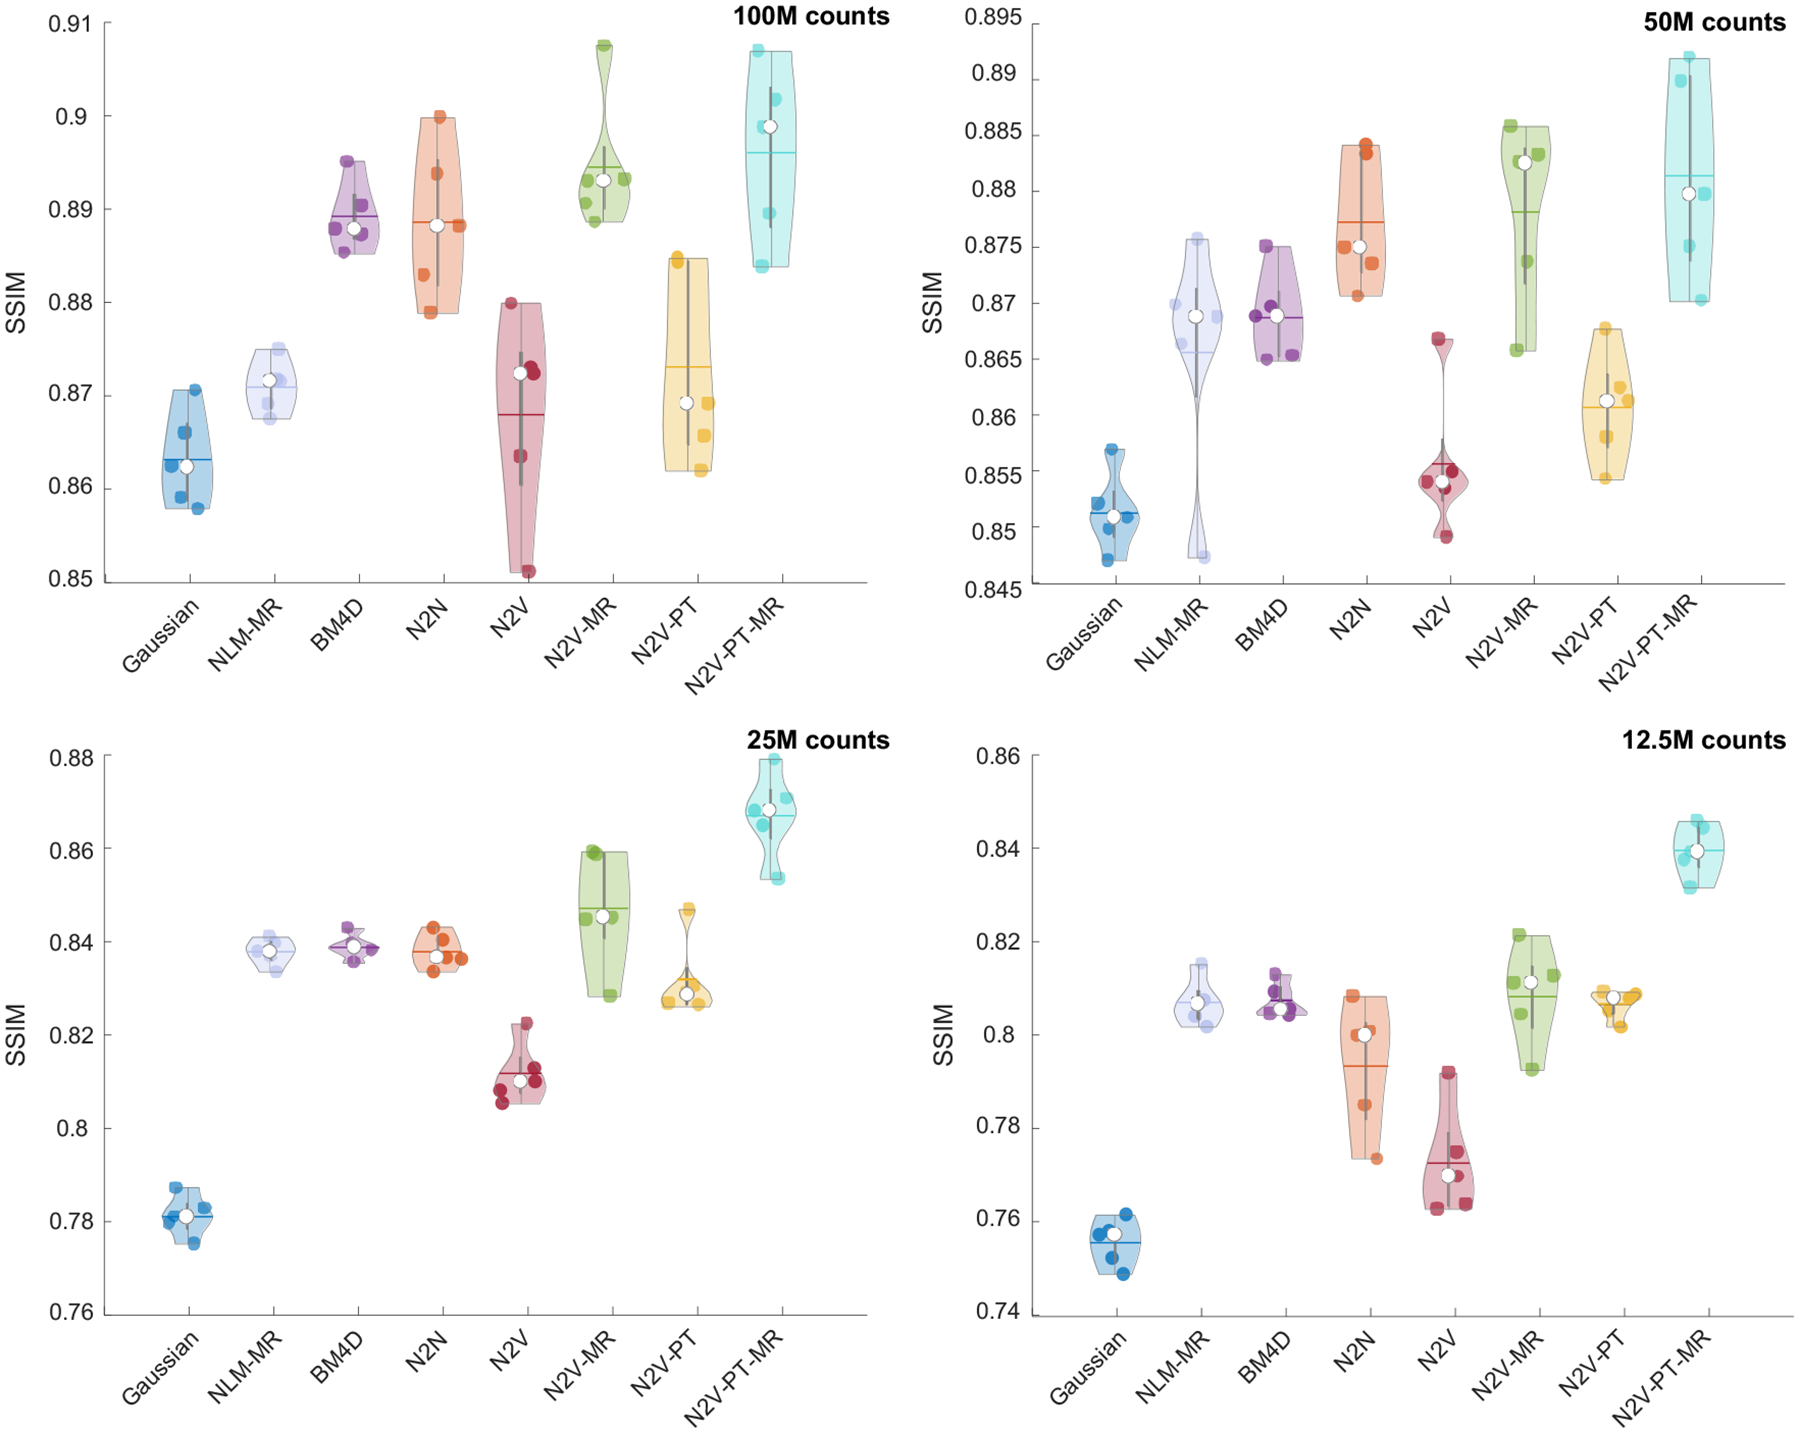
Figure 4. SSIM comparison for the simulation data.

Violin plots showing the SSIM distributions for the PET images obtained using Gaussian, NLM-MR, BM4D, N2N, N2V, N2V-MR, N2V-PT, and N2V-PT-MR denoising. The results are shown for four different noise levels: 100M counts, 50M counts, 25M counts, and 12.5M counts.
