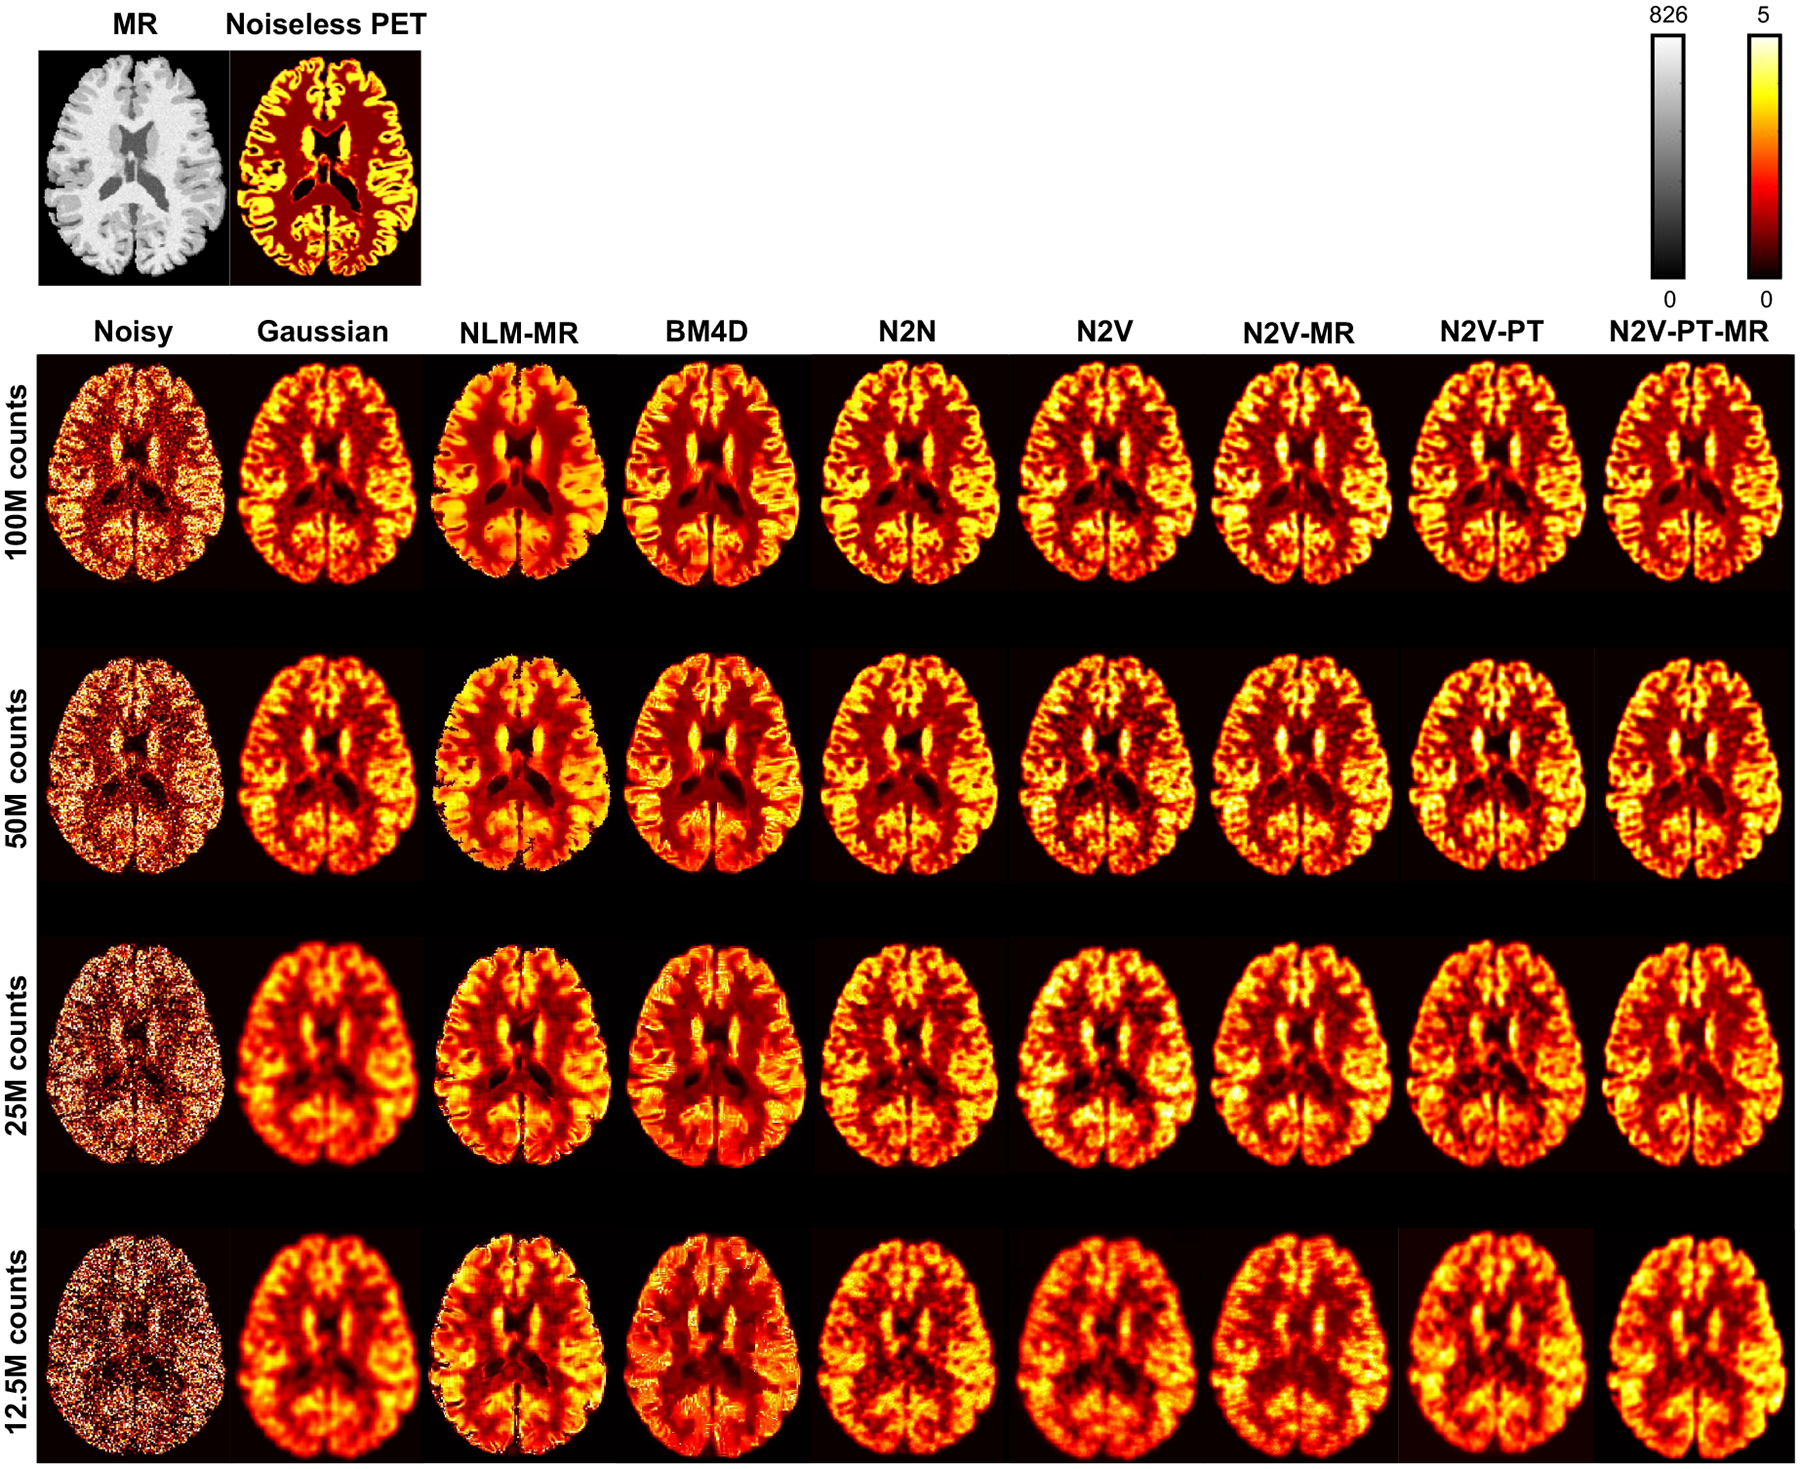
Figure 5. Example image slices for the simulation data.

Transverse image slices from the MR and the true (noiseless) PET are shown on the top. The noisy PET images and denoised PET images based on Gaussian, NLM-MR, BM4D, N2N, N2V, N2V-MR, N2V-PT, and N2V-PT-MR are shown for four different noise levels: 100M, 50M, 25M, and 12.5M counts. The cases visualized here have PSNR values close to the mean PSNR and correspond to the datapoints indicated as circles with a white fill in Figure 3.
