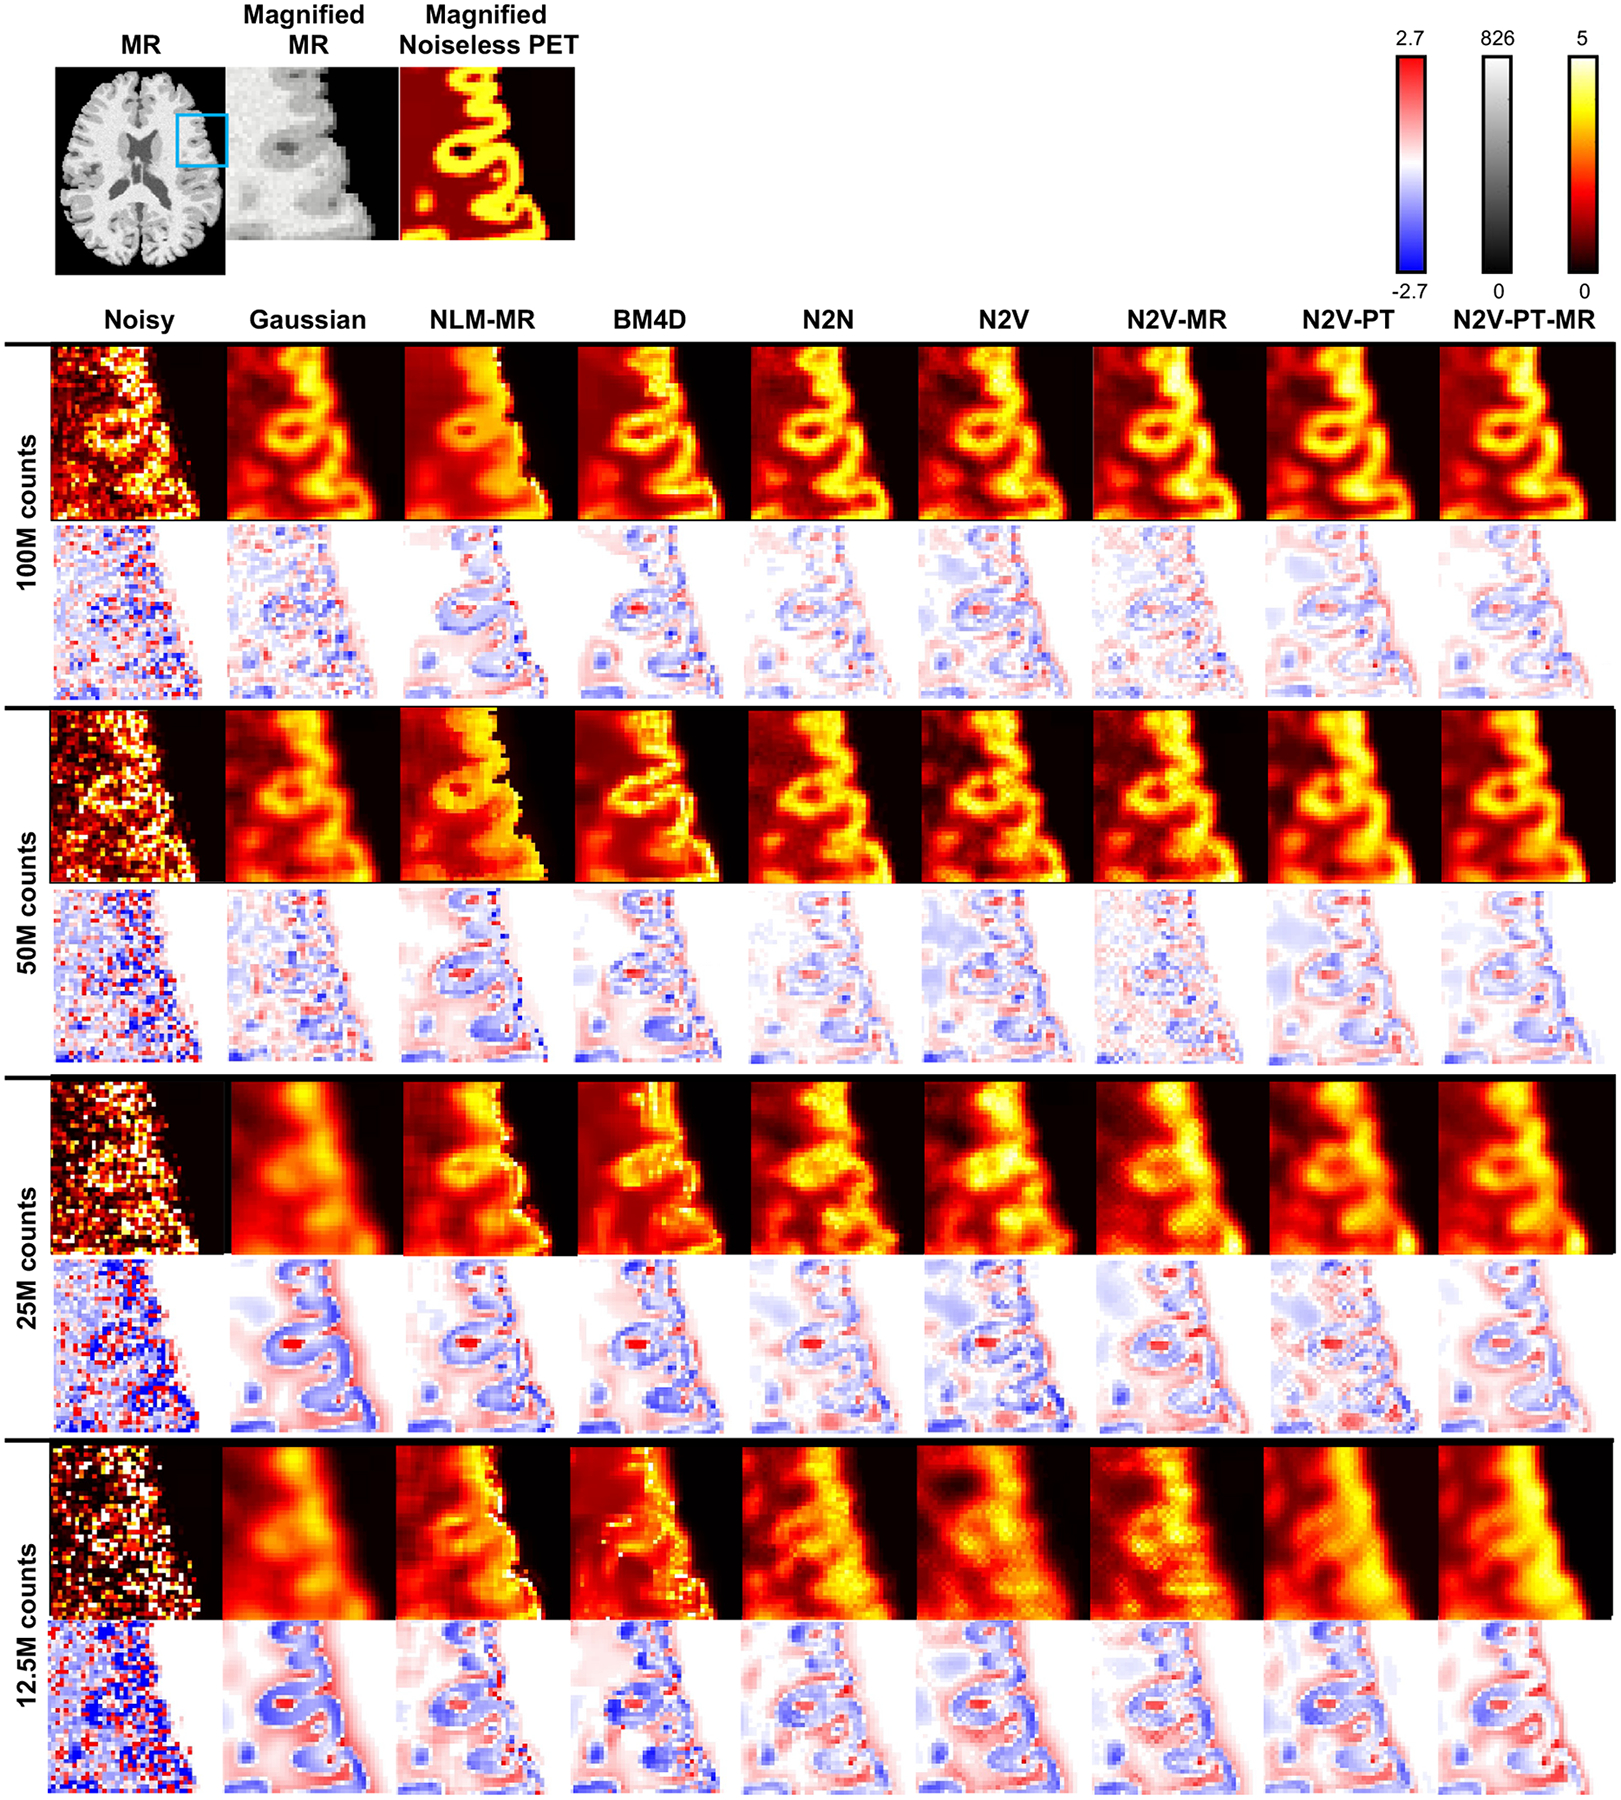
Figure 6. Magnified image slices and difference image slices for the simulation data.

Transverse image slices from the full MR image, the magnified MR subimage, and the magnified true (noiseless) PET subimage are shown on the top row. The blue box on the full MR image indicates the region magnified for closer inspection. The noisy and denoised PET subimages are shown using a “hot” colormap for Gaussian, NLM-MR, BM4D, N2N, N2V, N2V-MR, N2V-PT, and N2V-PT-MR methods and for four different noise levels: 100M, 50M, 25M, and 12.5M counts. The corresponding difference subimages (i.e., noisy - true or denoised - true) are displayed to underneath each image slice using a red-white-blue colormap.
