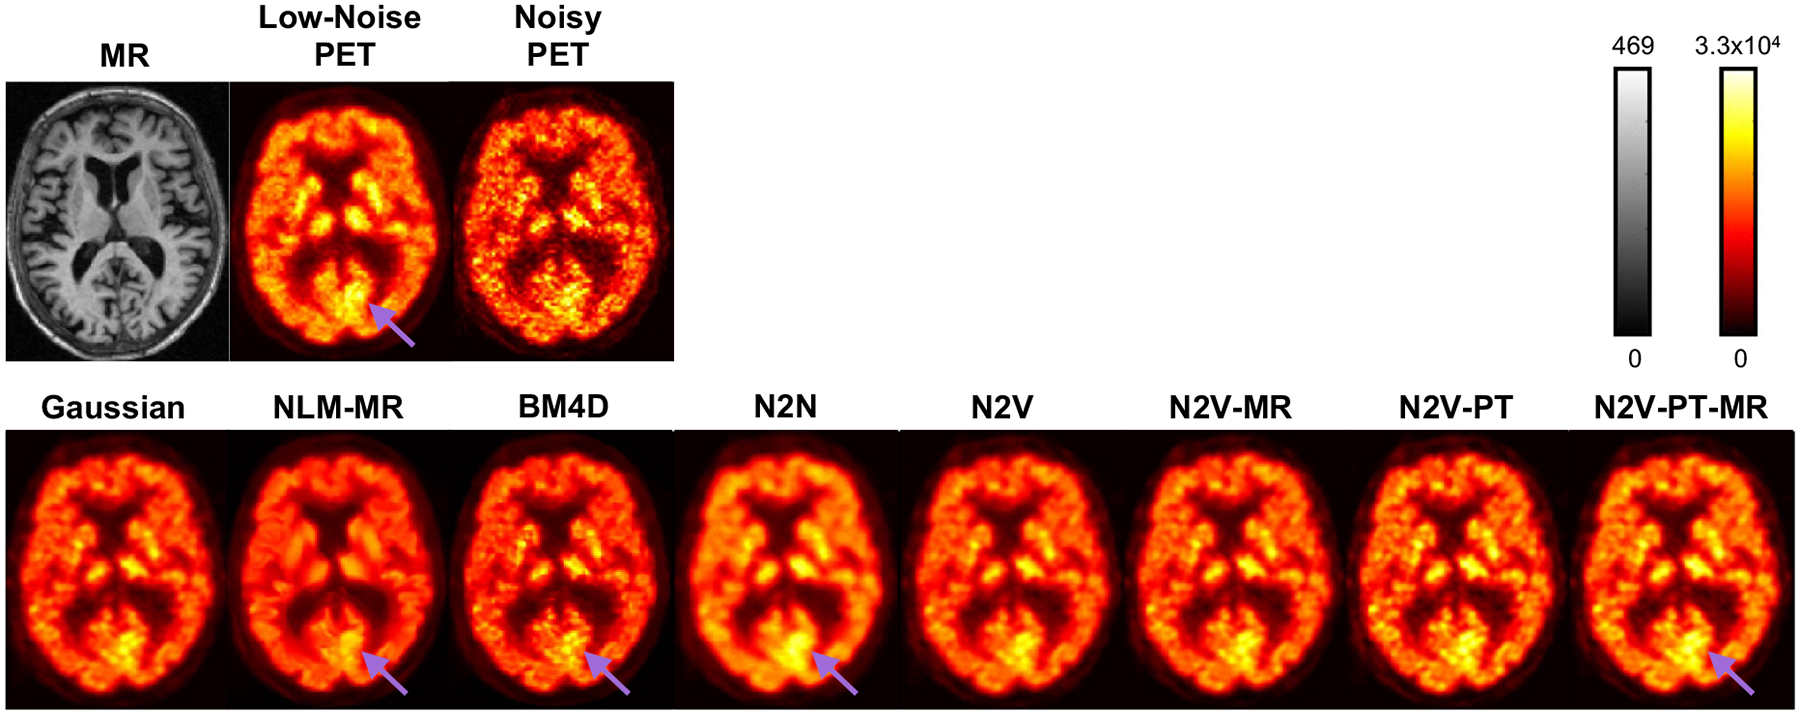
Figure 9. Example image slices for the clinical data.

Transverse image slices from the MR, the noisy PET, and low-noise PET are shown in the top row. Transverse image slices from the denoised PET images based on the Gaussian, NLM-MR, BM4D, N2N, N2V, N2V-MR, N2V-PT, and N2V-PT-MR techniques are shown in the bottom row. The cases visualized here have PSNR values close to the mean PSNR and correspond to the datapoints indicated as circles with a white fill in Figure 7.
