. 2021 Sep 7;81(21):5401–5412. doi: 10.1158/0008-5472.CAN-21-0730

Figure 1.

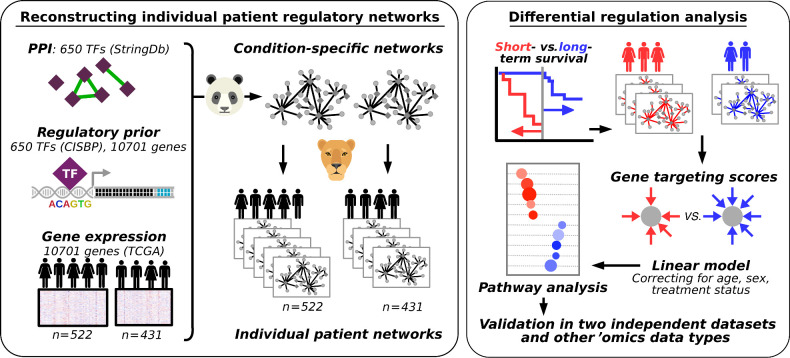
Figure 1. Schematic overview of the study. Left box, overview of the approach used to reconstruct individual patient networks with PANDA and LIONESS by integrating information on PPIs between TFs, prior information on TF-DNA motif binding, and gene expression data from two platforms using data from TCGA (n = 522 and 431 patients). Right box, overview of the differential regulation analysis.

Schematic overview of the study. Left box, overview of the approach used to reconstruct individual patient networks with PANDA and LIONESS by integrating information on PPIs between TFs, prior information on TF-DNA motif binding, and gene expression data from two platforms using data from TCGA (n = 522 and 431 patients). Right box, overview of the differential regulation analysis.