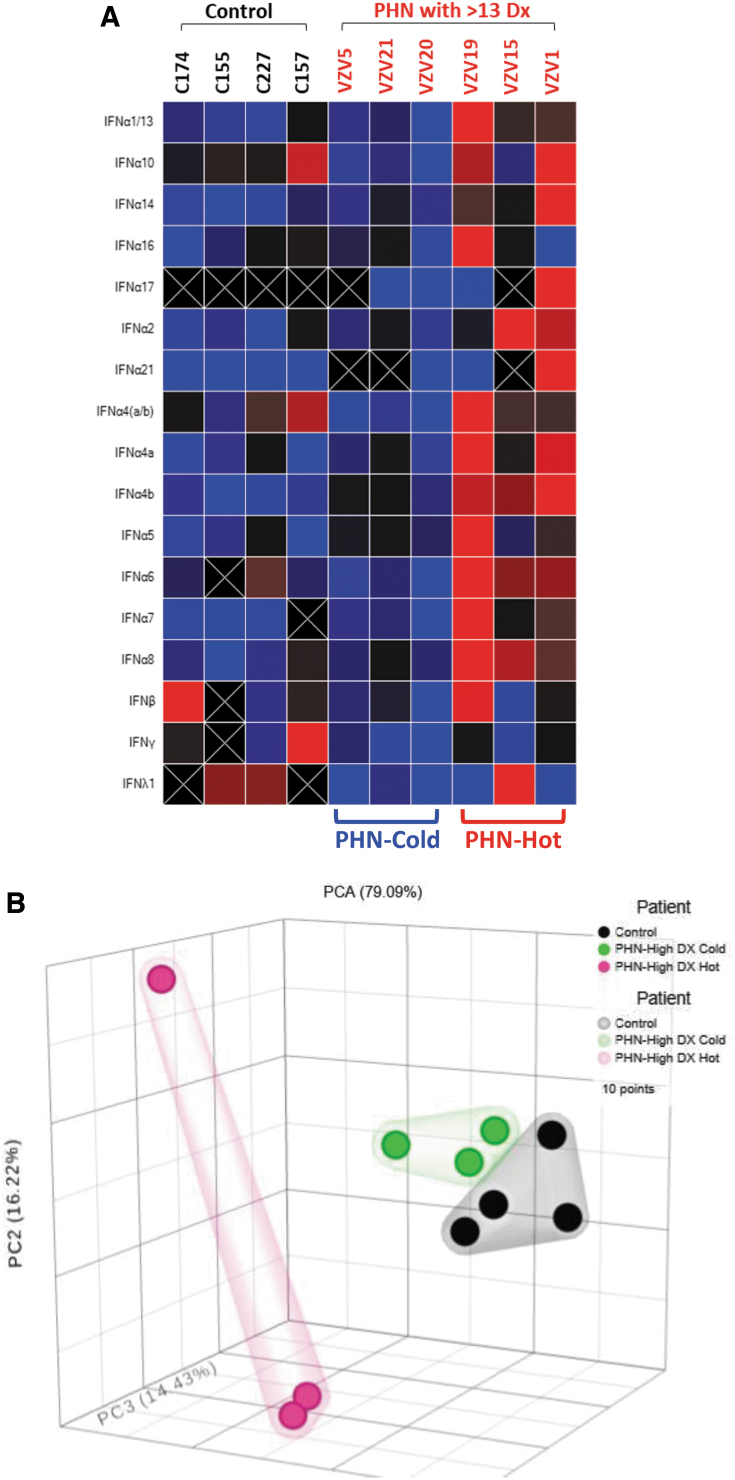
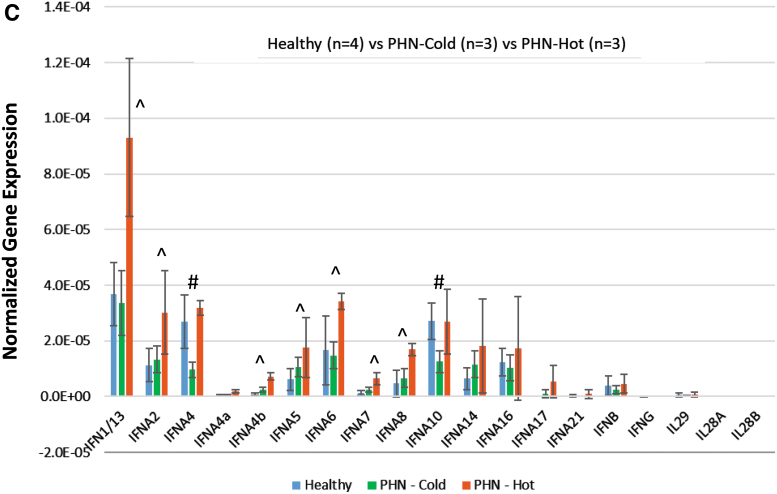
FIG. 3.
IEP analyses of PHN patients with complex diagnoses (Cohort C). These patients with quite complex diagnoses were subjected to the analyses. (A) Heatmap individual analysis suggested two subgroups in the Cohort C, identified as PHN-cold and PHN-hot. (B) PCA supported the observation of heatmap analyses, showing three distinct groups with PHN-cold clustered similar to the HC. (C) Statistical analyses comparing to HC showed that IFN A1/13, A2, A4b, A5, A6, A7, and A8 demonstrated a significant increase in PHN-hot group (labeled ^p < 0.05), but no change in PHN-cold cohort. IFN A4 and IFN A10 exhibited significant decrease in PHN-cold cohort (labeled #p < 0.05). PHN-hot cohort, nonetheless, showed no change. PCA, principal component analyses.


