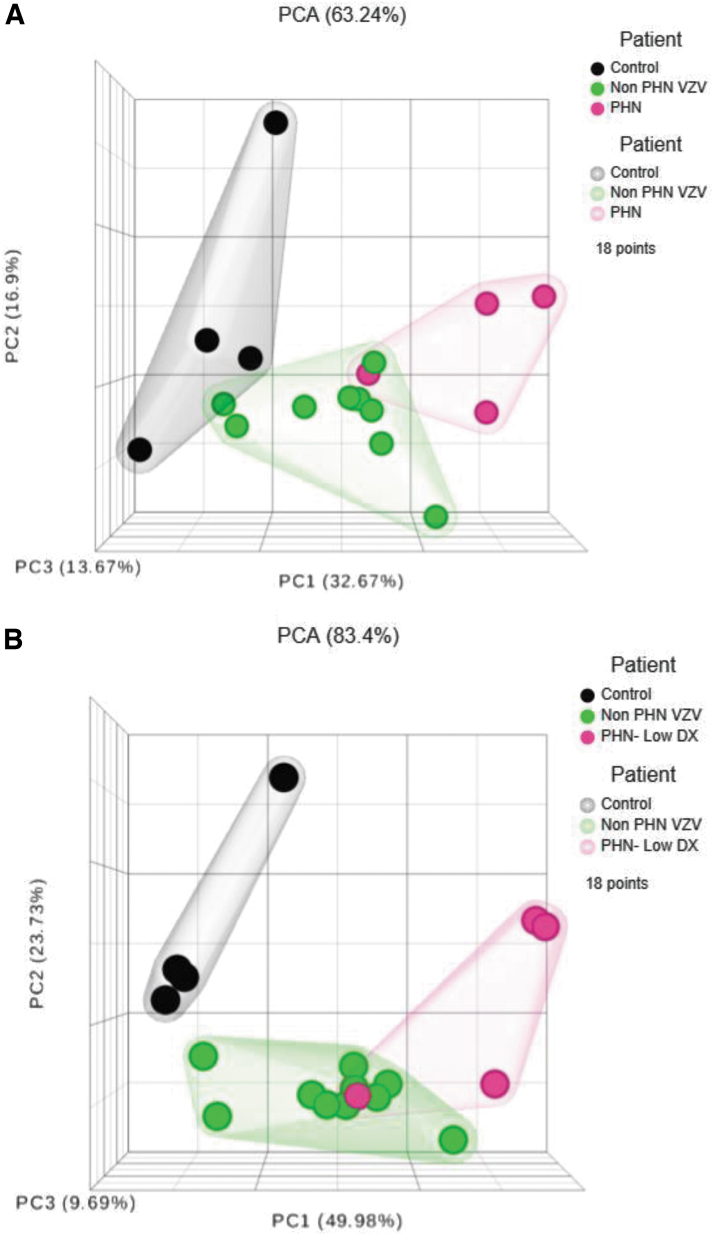
FIG. 5.
Summary of IEP between non-PHN and PHN patients in comparison to HC by PCA. (A) The three-dimensional hierarchical clustering analyses of all 19 IFNs by PCA described a differential expression pattern displaying a considerable degree of separation. (B) If only consider the nine “critical” IFNs (IFNA1/13, A2, A4, IFNA4b, A5, A7, A8, A10, and A14), the PCA clustergram depicted a pattern with better distinction among the cohorts.

