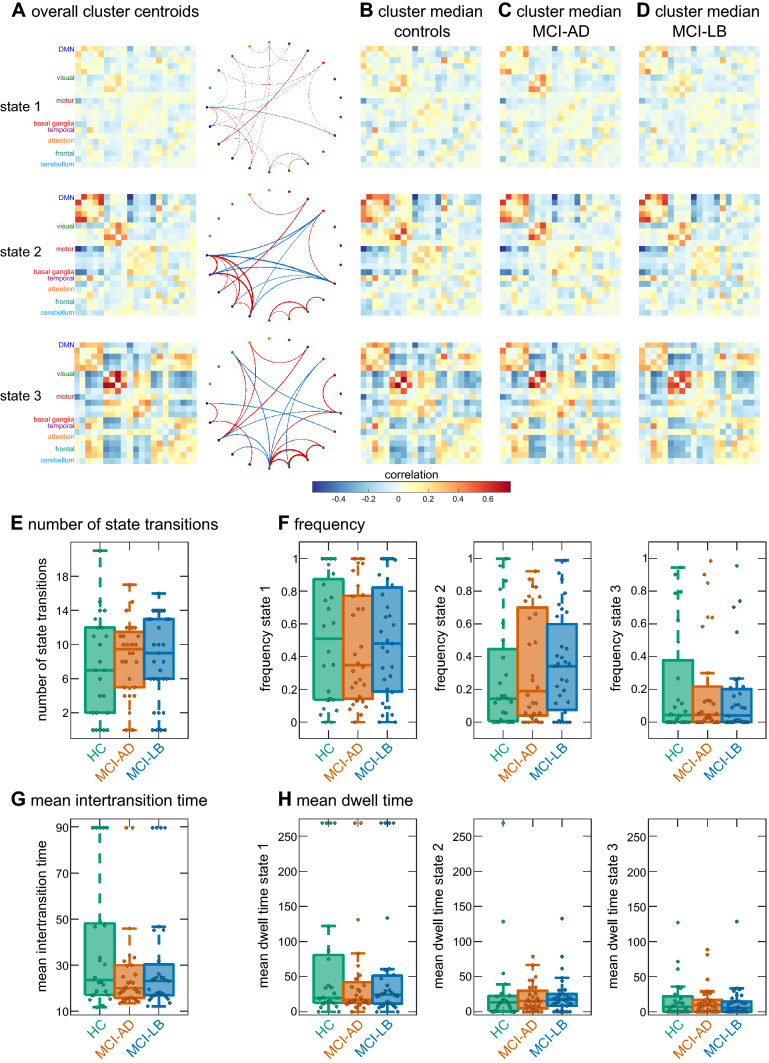
Fig. 3.
Results from the sliding-window k-means analysis with low-dimensional Biobank RSNs (d = 21). a Centroids resulting from clustering on all windows and participants. The network graphs are showing only the 5% strongest positive (red) and negative (blue) connections. b Cluster medians in the healthy control group. c Cluster medians in the MCI-AD group. d Cluster medians in the MCI-LB group. e Group comparison of the overall number of state transitions. f Group comparison of frequency of occurrence of the three states. g Group comparison of mean time between two state transitions. h Comparison of mean dwell time of the three states. In the boxplots the central line corresponds to the sample median, the upper and lower border of the box represent the 25th and 75th percentile, respectively, and the length of the whiskers is 1.5 times the interquartile range. HC healthy controls, MCI-AD mild cognitive impairment with Alzheimer’s disease, MCI-LB mild cognitive impairment with Lewy bodies

