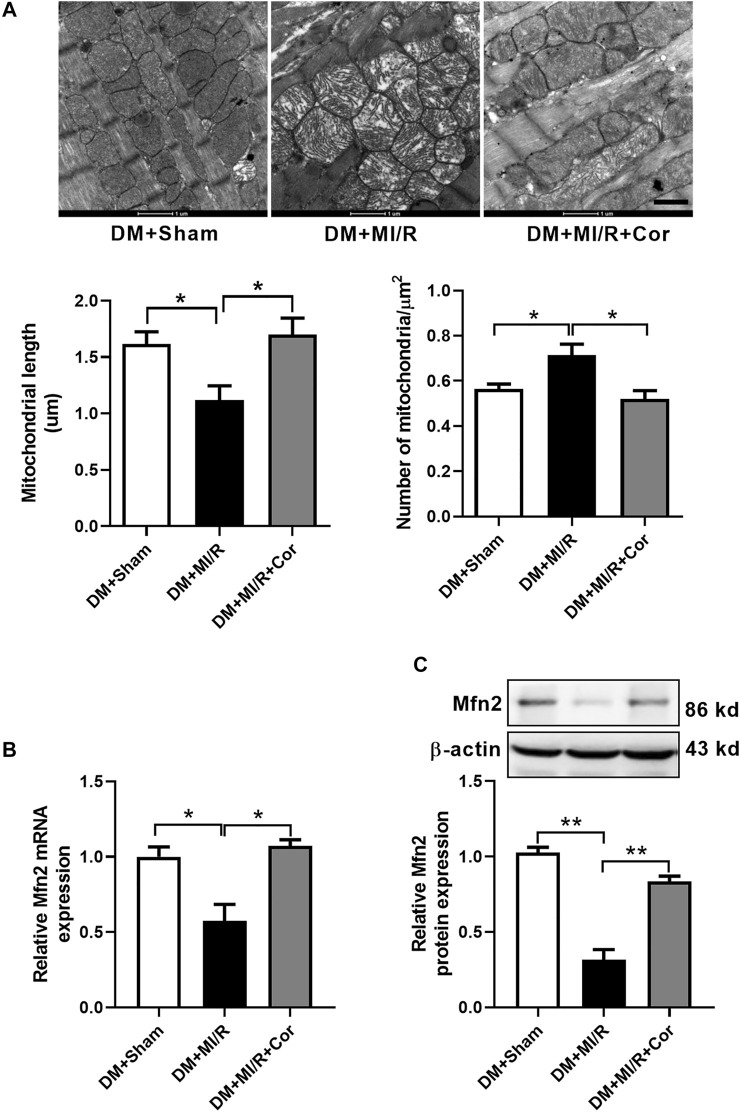
FIGURE 2.
Cordycepin stimulated mitochondrial fusion and enhanced Mfn2 expression in ischemic/reperfused hearts. (A) Representative transmission electron microscopic images of mitochondria in heart tissues and quantitative analysis of mitochondria length and the number of mitochondria per um2. (B) Quantitative RT-PCR analysis of Mfn2 mRNA expression level in mouse heart. (C) Western blotting and quantitative analysis of Mfn2 protein expression levels in heart tissues of mouse. DM, diabetes mellitus; MI/R, myocardial ischemia/reperfusion; Sham, sham-operated control rats; Cor, cordycepin. Scale bar, 1 μm *p < 0.05, **p < 0.01. n = 4 mice.

