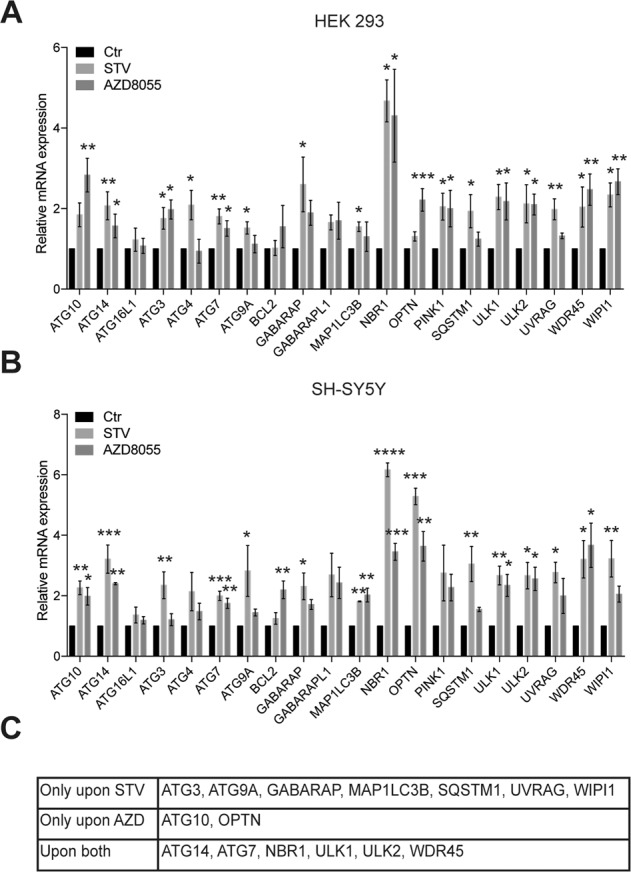
Fig. 3. Validation of the “induction list” by Real-time PCR in cell lines during fasting or MTOR inhibition.

HEK-293 (A) and SH-SY5Y (B) cells were cultured in EBSS starvation medium for 4 h or treated with AZD8055 (100 nM) for 8 h. ATG10, ATG14, ATG16L1, ATG3, ATG4, ATG7, ATG9A, BCL2, GABARAP, GABARAPL1, MAP1LC3B, NBR1, OPTN, PINK1, SQSTM1, ULK1, ULK2, UVRAG, WDR45, and WIPI1 mRNA expression were assessed by qPCR and were normalized to HPRT1 mRNA levels, used as internal control. Data display the fold-changes relative to control cells (n = 3-4-5-6, based on the variation of each gene expression) and are expressed as the mean value ± SEM. C Summary of those genes that were significantly upregulated in both cell lines upon starvation (STV), upon AZD8055 treatment (AZD) or upon both conditions (both). D List of genes for the evaluation of lysosomal biogenesis. Statistical analysis was performed using one-way ANOVA with Dunnett’s multiple comparisons test. (*p < 0.05; **p < 0.01; ***p < 0.001; ****p < 0.0001).
