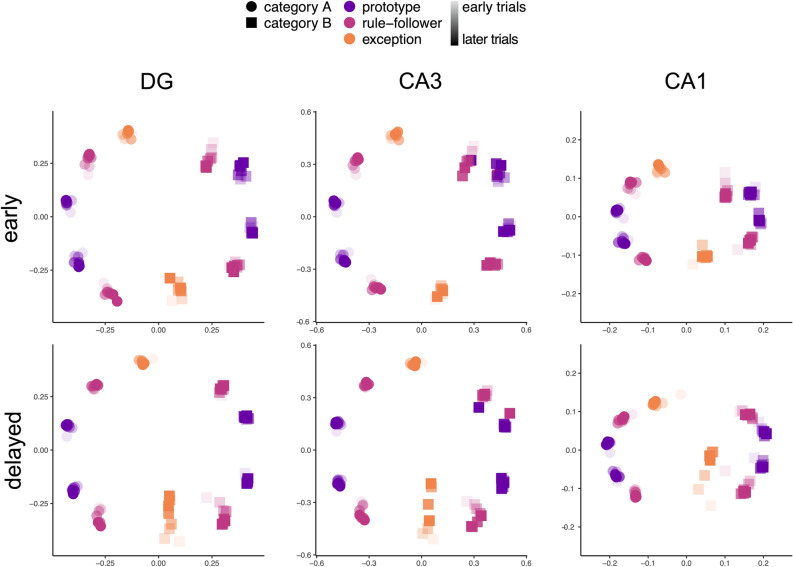
Figure 6.
Sammon mapping projections of HC model subfield representations. Two-dimensional projections for stimulus representations within each subfield (columns) in the early (top) and delayed (bottom) sequences. Representations from tests at various time points throughout learning (early: trial 12, 36, 48, 72, 96, 120, 144; delayed: trial 24, 48, 60, 72, 84, 96, 120, 144) are depicted within the same plot with increasing opacity for later time points. The model clearly represents the space well after a limited number of trials. Category coding was apparent across subfields and sequences with category A stimuli (circles) on the left of the primary dimension and B stimuli (squares) on the right. Although stimulus locations were fairly consistent across subfields, a large shift was observed for exception B (orange square) across learning trials in the delayed condition. This shift was not observed for exception A.

