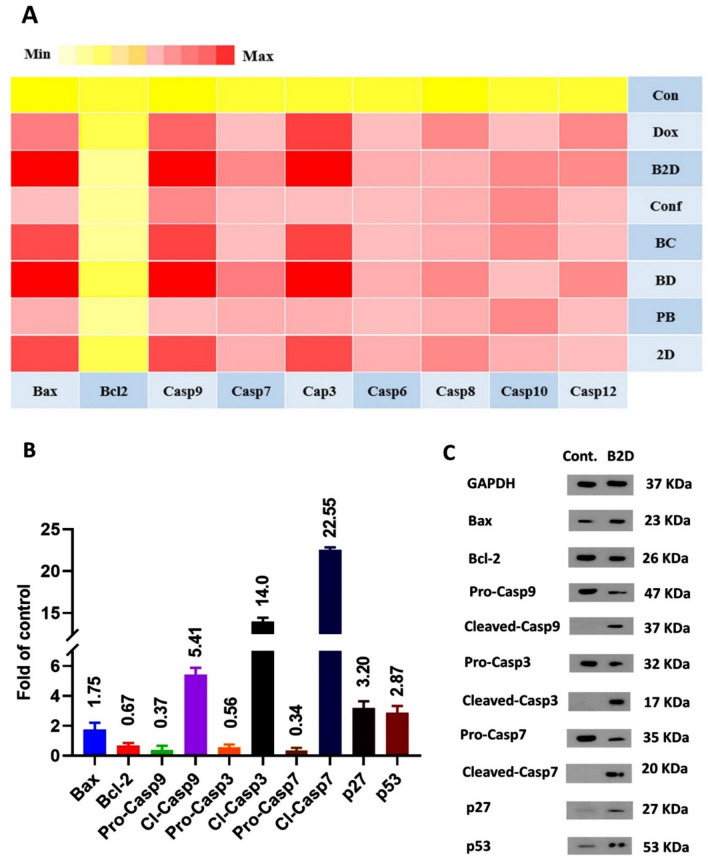
Figure 8.
(A) Results of real-time PCR analysis of MDA-MB-231 cells treated with all formulations (0.259 μg/mL of B2D, 2D, BD, Dox, BC and Conf and 2.59 μg/mL of PB) as the heat map of expression level of genes related to un-treated control group (gene expresion = 1). The yellow and light-yellow colors are the signs of lack of gene expression or downregulation of it and red color shows upregulation of gene expression related to the control (genes: Bcl-2, Bax, Caspase-3, Caspase-6, Caspase-7, Caspase-8, Caspase-9, Caspase-10, Caspase-12 and GAPDH as the internal control gene); (B) Diagram of proteins expression changes related to the control group (protein expression = 1) obtained from western blotting (the MDA-MB-231 cells were treated by B2D with concentration of 0.259 μg/mL). Proteins: Bcl-2, Bax, pro-Caspase-9, Cleaved-Caspase-9, pro-Caspase-3, Cleaved-Caspase-3, pro-Caspase-7, Cleaved-Caspase-7, p27 and p53, and GAPDH as internal control, n = 2; (C) Images of western blotting of the MDA-MB-231 cells treated with B2D (0.259 μg/mL). Un-treated cells were considered as the control group. (Abbreviations: PB: blank βCD-g-PMA-co-PLGA micelles, B2D: co-drug loaded βCD-g-PMA-co-PLGA micelles, BD: Dox loaded βCD-g-PMA-co-PLGA micelles, BC: Conferone loaded βCD-g-PMA-co-PLGA micelles, Dox: Free Doxorubicin, Conf: Free Conferone, 2D: Free Doxorubicin-Conferone).

