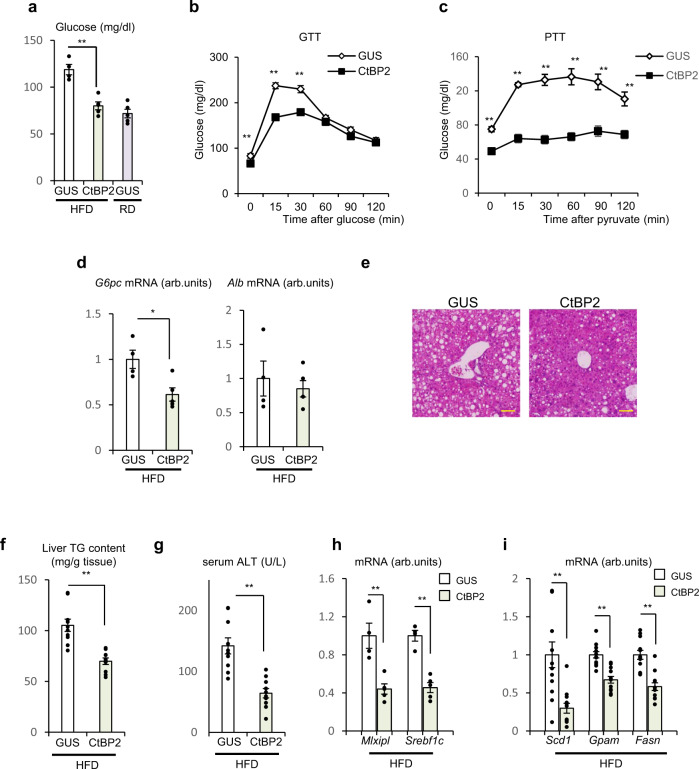
Fig. 6. CtBP2 gain of function in liver ameliorates diabetes and hepatic steatosis in obese mice.
CtBP2 was exogenously expressed in the liver of diet-induced obese mice by adenoviral transduction (AdCtBP2), along with its control (AdGUS). Animals were analyzed after 3–7 days of transduction (a–d, h overnight fasted, e–g, i 6-h fasted). a Blood glucose levels (n = 4 for GUS/HFD, n = 5 CtBP2/HFD, and n = 5 for GUS/lean, biologically independent animals, p = 7.8 × 10⁻⁴). HFD high-fat diet, RD regular diet. b Glucose tolerance test (GTT, n = 10, biologically independent animals, p -values are 8.8 × 10⁻³ for 0 min, 1.0 × 10⁻⁸ for 15 min, 1.4 × 10⁻⁴ for 30 min). c Pyruvate tolerance test (PTT, n = 9 for GUS, n = 10 for CtBP2, biologically independent animals, p values are 7.6 × 10⁻⁶ for 0 min, 2.5 × 10⁻⁹ for 15 min, 1.1 × 10⁻⁷ for 30 min, 2.6 × 10⁻⁶ for 60 min, 4.9 × 10⁻⁵ for 90 min, 3.0 × 10⁻⁴ for 120 min). d Gene expression in liver (n = 4 for GUS, n = 5 for CtBP2, biologically independent animals, p = 0.015). e Representative hematoxylin and eosin stained sections of liver. Yellow bars indicate 100 μm. f Liver triglyceride (TG) content (n = 10, biologically independent animals, p = 6.6 × 10⁻⁵). g Serum ALT levels (n = 10, biologically independent animals, p = 7.4 × 10⁻⁵). h, i Lipogenic gene expression (n = 4 (h), n = 10 (i), biologically independent animals, p = 3.8 × 10⁻³ (Mlxipl) and 2.1 × 10⁻⁴ (Srebf1c), 8.3 × 10⁻⁴ (Scd1), 1.7 × 10⁻⁵ (Gpam) and 2.0 × 10⁻⁵ (Fasn), respectively). Data are expressed as the mean ± SEM. * and ** denote p < 0.05 and p < 0.01 evaluated by unpaired two-tailed Student’s t-test, respectively. Source Data are provided as a Source Data file.

