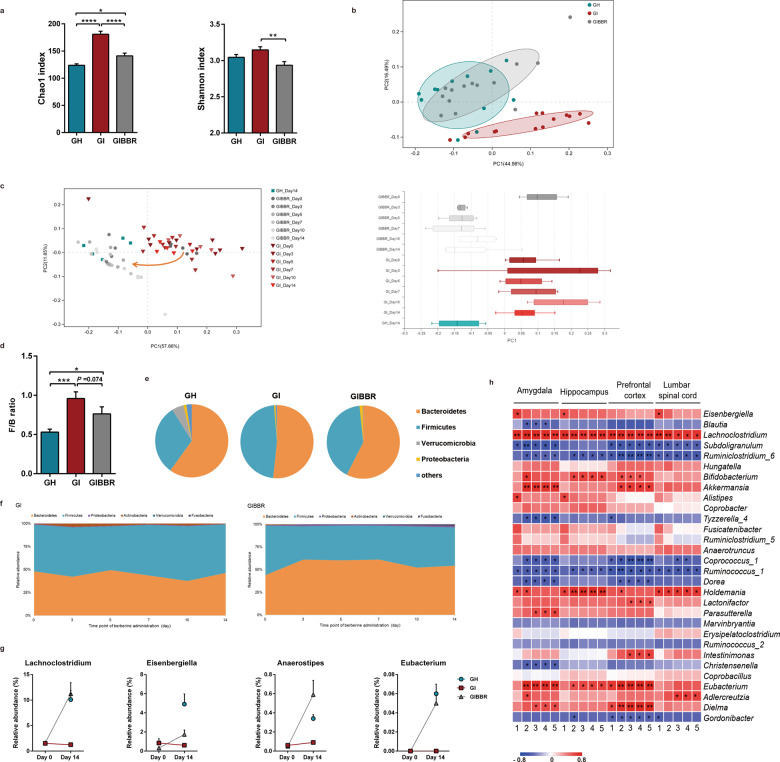
Fig. 5. Berberine altered the structure and composition of the IBS-derived gut microbiota.
a Chao1 and Shannon indexes indicative of community richness and diversity. n = 12 (GH); n = 14 (GI, GIBBR). b Principal coordinate analysis based on weighted UniFrac distances of the relative abundances of bacterial OTUs after berberine treatment. n = 12 (GH); n = 14 (GI, GIBBR). c Weighted UniFrac principal coordinate analysis showing dynamic shifts after berberine or vehicle treatment. i = 5–7/group. d Comparison of F/B ratios. e Bacteria composition at the phylum level. n = 12 (GH); n = 14 (GI, GIBBR). f Dynamic alterations in different phyla in fecal samples during berberine or vehicle treatment. n = 5–7/group. g Relative abundances of selected genera enriched by berberine. n = 12 (GH); n = 14 (GI, GIBBR). h Heatmap showing the relationships between different genera and morphological parameters of microglia. n = 6/group. *P < 0.05, **P < 0.01, ***P < 0.001, ****P < 0.0001. 1: Dendritic area; 2: dendritic length; 3: number of branch points; 4: number of segments; 5: number of terminal points.

