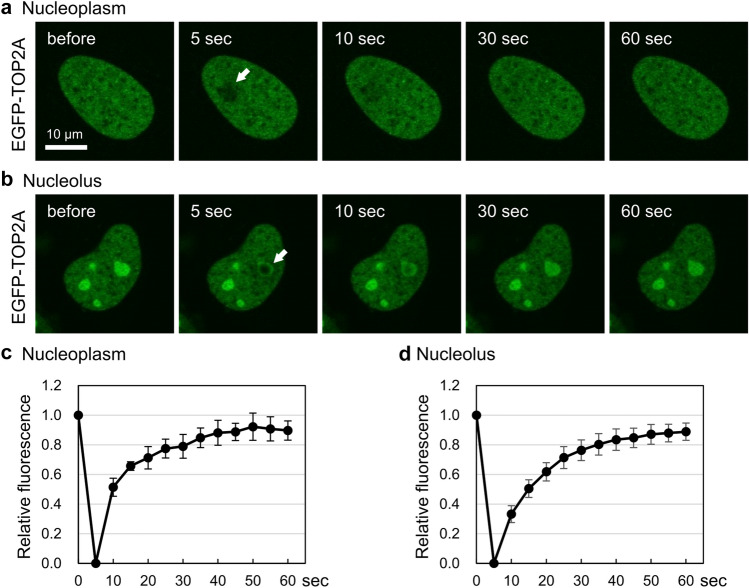
Figure 3.
EGFP-TOP2A is highly mobile in the nucleoplasm and nucleolus. (a) Representative images of FRAP analysis of EGFP-TOP2A in the nucleoplasm. A small area of the nucleoplasm (shown with a white arrow) of a HeLa cell expressing EGFP-TOP2A was photobleached, and fluorescence images were captured at the indicated time points. (b) Representative images of FRAP analysis of EGFP-TOP2A in the nucleolus. A HeLa cell expressing EGFP-TOP2A was incubated with 25 mM 2DG and 10 µM CCCP for 20 min, and photobleaching in a small area of the nucleolus (shown with a white arrow) was carried out. (c, d) Quantification of fluorescence signals of EGFP-TOP2A in the nucleoplasm (c) and in the nucleolus (d). Fluorescence images were captured at 5 s intervals. Photobleaching was conducted at 5 s. Average values of relative fluorescence and SD were calculated (n = 10).

