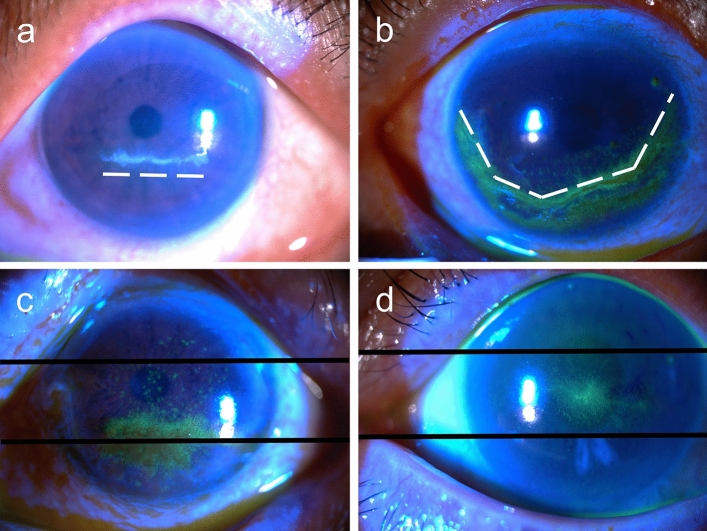
Figure 2.
Examples of the orientation and location of anti-glaucoma agent-induced pseudodendritic lesions. The orientation was only measured in linear lesions (type I and II). The white dashed lines illustrate the contour of corneal lesions. The black solid lines divided the corneas as three equal parts. (a) Horizontal orientation. (b) Curvilinear orientation. (c) Lower-located pseudodendritic lesions, with more than 2/3 of the lesion involved the lower cornea. (d) Central-located pseudodendritic lesions, with more than 2/3 of the lesions involving the central cornea.

