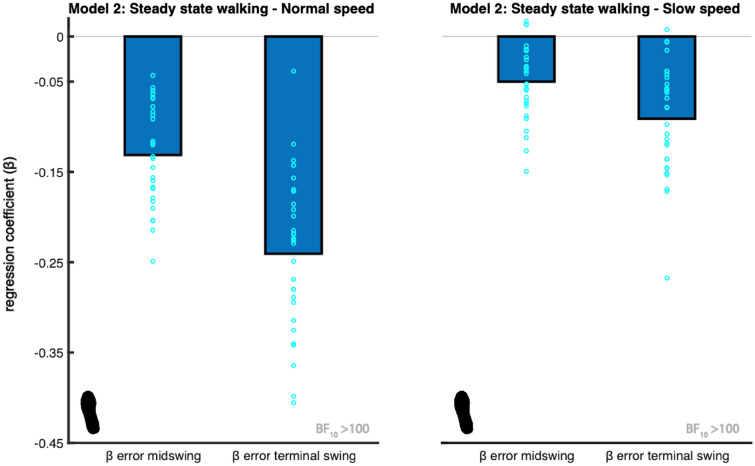
Figure 3.
Mean regression coefficients of the ankle strategy model (2). The predictors (β) are the foot placement error at mid-swing and terminal swing. The foot print represents the steady-state walking condition (see Table 1). The light blue circles represent individual data points. The negative relationship shows ankle moments accommodate for stepping inaccuracies, by shifting the CoP in the opposite direction. The Bayes factors (BF10) represent the degree of evidence supporting the regression coefficients to be different from zero. This figure was created using Matlab 2021a (https://www.mathworks.com/products/matlab.html) and Adobe Illustrator CC 2018 (https://www.adobe.com/nl/products/illustrator.html).

