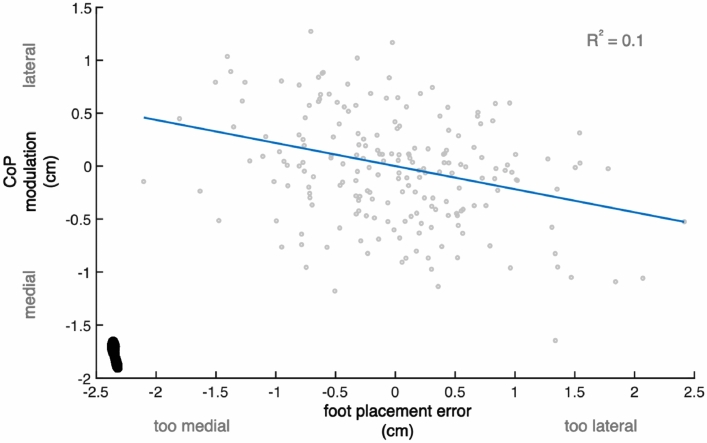
Figure 4.
Relationship between foot placement error and subsequent CoP shift. Example of one participant, demonstrating a negative relationship between CoP modulation (ankle moment control) and foot placement error. The blue line represents the fitted model (2) and the data points represent individual (right and left) steps. The foot print represents the steady-state walking condition (see Table 1). Compared to the other participants, this participant demonstrated a relatively high relative explained variance (R2 = 0.1). This figure was created using Matlab 2021a (https://www.mathworks.com/products/matlab.html) and Adobe Illustrator CC 2018 (https://www.adobe.com/nl/products/illustrator.html).

