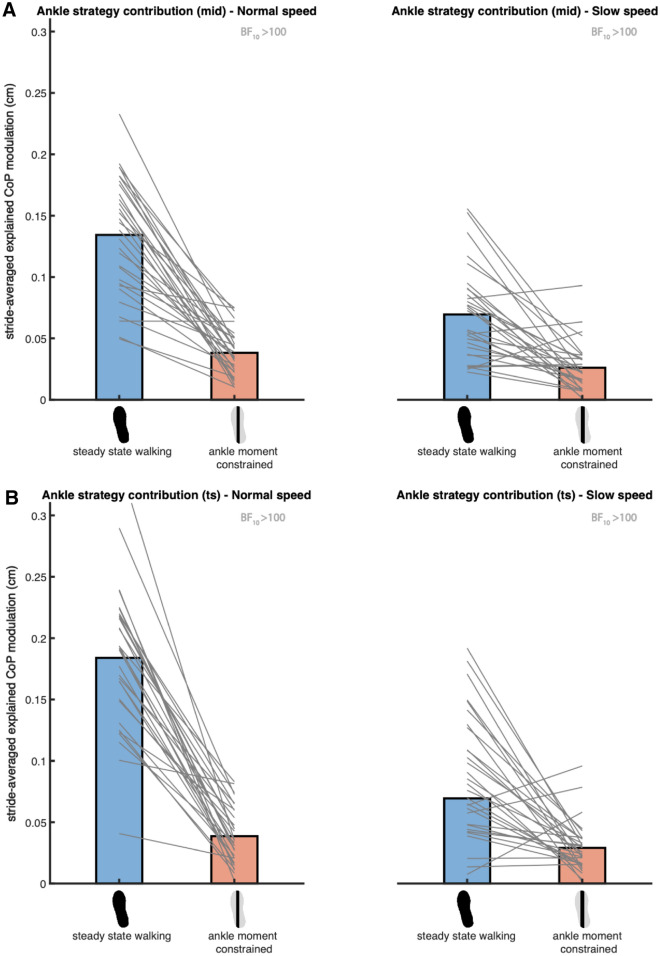
Figure 6.
Mean absolute explained variance of the ankle strategy model (2). For normal (left) and slow (right) walking speeds panels A and B depict respectively the absolute explained variances for the foot placement error at mid- and terminal swing. Blue and red bars represent the steady-state walking and ankle moment constrained conditions respectively. In this figure the absolute explained variance is expressed as the square root of the stride averaged explained variance, as a reflection of the magnitude of the average explained CoP shift in centimeters. The grey lines connect individual data points. The Bayes factors (BF10) denote the degree of evidence for a decreased absolute explained variance in the ankle moment constrained condition, as compared to steady-state walking. This figure was created using Matlab 2021a (https://www.mathworks.com/products/matlab.html) and Adobe Illustrator CC 2018 (https://www.adobe.com/nl/products/illustrator.html).

